
Abstract
In precision agriculture (PA) fertilizing, based on soil testing, production maps and crop nitrogen (N) demand, is the key to maximizing yields and tempering fertilizer costs. A trend study has considered the output / input relationships performed on a farm that has progressively adapted to PA procedures over two decades. The evolutions of the variability parameters of yield, comprising the repeatability coefficient of repeated plots, the vegetative vigour (NDRE) at the panicle initiation (pi) stage, and the nitrogen utilization efficiency (NUE) were monitored and compared by means of mixed linear models over a six-year period, after the variable nitrogen (N) fertilization rate (VNFR) had been enlarged to the whole 230 ha of one farm. At pi key fertilization stage, a corrective dose was applied by tacking the correlation between Npi and the measured NDRE in strong negative mode. The evolution of the yield, for the 2012-2017 interval, based on 1165 ha-1 parcel-data, showed a significant yearly increase of 2.3% more than the regional trend (+0.5%). The variability parameters of the yield, that is, the standard deviation (+7.3%), range (+7.1%), coefficient of variation (+5.4%) and maximum (+2.1%) were enhanced over the years, but the minimum remained stable. The repeatability of the parcel yield generally appeared low (r = +0.31), but it tended to increase by 8.3% year-1 (P = 0.018). At the same time, the vegetational vigour also showed significant increases of the NDRE means (+3.0%) as well as of the maximum (+0.8%), but also large oscillations in the standard deviation and in the coefficient of variation. No significant regression of the NDRE on the coefficient of variation of the yield was established. The favorable increase in yield was found to be independent of the distributed N-total. A strong negative correlation (imposed) between N-pi and NDRE (-0.90) and a negative correlation with production were observed for a sample field (but in the area of maximum production). It is recommended that a partial correlation between Yield and N-tot should be considered in the I /O features for a parity of NDRE, which apparently decreases the negativity of the relationship. In short: with the same total input of N, the PA increased the yield, but also its variability – and it did not reduce the variability as predicted by the theory - by strengthening the repeatability. This is an evidence that in many of the parcels with minimum yield the limiting factors cannot be referred to the N availability.
Author Contributions
Academic Editor: Abubaker Haroun Mohamed Adam, Department of Crop Science (Agronomy), College of Agriculture, Bahri University- Alkadaru- Khartoum -Sudan.
Checked for plagiarism: Yes
Review by: Single-blind
Copyright © 2019 Giuseppe Sarasso, et al.
 This is an open-access article distributed under the terms of the Creative Commons Attribution License, which permits unrestricted use, distribution, and reproduction in any medium, provided the original author and source are credited.
Competing interests
The authors have declared that no competing interests exist.
Citation:
Introduction
After long and detailed studies focused on production models developed in universities 1,2,3and adopted by extension services 4,5 it is now time to advance precision agriculture (PA), resulting from the developments made in the mechanical agricultural industry and from the work of scientists who produced a body of 17,756 scientific publications, indexed in the Scopus database from 2000 to 2016, throughout the world 6. The PA mainly involves: reduction of overlaps of fertilizers and pesticides during the distribution; soil tillage managements; precision in the dosage of the inputs for the best production. The theoretical potentialities of the various operating instruments now available are challenged by the “big data” generated from the fields as well as from the environment. However, the complexity of the large number of factors, and the multiple interference between their forcing activities that affect production are incomparably less “precise” than the PA definition suggests. Experimenting with a single sensor (Figure 1) is relatively simple, but it is not straightforward to include the results in the complex system of factors that influence productivity, many of which are unknown or uncontrollable.
Figure 1.The articulated mechanic support of the vigor sensor, to compare the different responses at three inclinations, with best result when inclined 16° from the horizontal.
The progress in yield raising and homogenizing by use of the fertilization maps may be quickly achieved at the beginning of the process 4,5and this fact is exemplified in the Figure 2.
Figure 2.The improvement of the evenness of yields achieved between 2001 (mean 7.94 t ha-1) and 2007 (mean 8.97 t ha-1) modulating the rates of organic fertilizer, based on yield maps.
Since the PA is welcome in rice cultivation, in this work we aimed to study in retrospect the productive consequences of its application on a PA Italian rice farm, oriented to obtain maximum yields. In this paper we are concerned in featuring the trends in the variability parameters, obtaining some lessons from fields.
Experimental Procedure
A trend study has considered the output / input relationships performed on a farm that has progressively adapted to PA procedures over two decades. The evolutions of the variability parameters of yield, comprising the repeatability coefficient of repeated plots, the vegetative vigour (NDRE) at the panicle initiation (pi) stage, and the nitrogen utilization efficiency (NUE) were monitored and compared by means of mixed linear models over a six-year period, after the variable nitrogen (N) fertilization rate (VNFR) had been enlarged to the whole farm.
Material and Methods
The PA experience started in 1998 with a harvester which was equipped with a yield meter, and then with a yield monitor, a satellite receiver and a light bar to assist manual drive. The farm now spreads fertilizers using a VRT technology, following prescription maps or real time signals of vigor sensors using an OptRx by AgLeader (Figure 3), which reads both NDVI (wavelengths of 670 nm and 780 nm) and NDRE (730 nm and 780 nm).
Figure 3.The tractor’s cab full of monitors and cables, due to the lack of communication between monitors and sensors of different brands
Before N-pi administration, a drone was used to assess the mean and probable range of the NDRE readings of the sensor, and to fix the thresholds. Following an RTK signal, herbicides are sprayed by a VRT sprayer, which controls the opening and closing of the nozzles lead from a GPS signal, and yield maps are obtained by an harvester equipped with an AgLeader yield meter. All the technology had to be adapted to the soil (Table 1). The name of the farm, “Palestro” (GPS data of the farm buildings: WGS 84 zone 32 N Lat 45,371488 – Lon 8,298165), comes from the Latin “Palustris”, which means Swampy. All the soil, that is, 249 ha, of which 230 ha are cultivated, is silty-clay, and is flooded from April to August. Moreover, a rice monoculture has been grown on this farm since 1965.
Table 1. Range in characteristics of soil samples from 14 fields in 2012-16, at a depth of 30 cm.| Items | Units | Worst | Best |
| Average Yields | t ha-1 | 7.30 | 8.29 |
| Gravel (>2mm) | mg kg dry sub.-1. | 12.57 | 16.00 |
| Sand (2-0.5 mm) | mg kg dry sub. -1 | 312.71 | 332.71 |
| Silt (0.5-0.02 mm) | mg kg dry sub. -1 | 582.29 | 565.14 |
| Clay (<0.02 mm) | mg kg dry sub. -1 | 105.00 | 102.14 |
| pH H2O | pH units | 5.70 | 5.77 |
| pH CaCl2 | pH units | 4.97 | 5.01 |
| CaCO3 TOT | mg kg dry sub. -1 | 0.00 | 0.00 |
| CaCO3 ACTIVE | mg kg dry sub. -1 | 0.00 | 0.00 |
| Organic Matter (calculated) | mg kg dry sub. -1 | 22.57 | 22.00 |
| Organic C (Dumas) | mg kg dry sub. -1 | 13.11 | 12.76 |
| N TOT | mg kg dry sub. -1 | 1.30 | 1.24 |
| C/N rate | 9.91 | 10.23 | |
| Cationic exchange capacity | meq 100g dry sub. -1 | 13.46 | 13.11 |
| Exchangeable Ca | meq 100g dry sub. -1 | 4.43 | 4.22 |
| Exchangeable Mg | meq 100g dry sub. -1 | 0.86 | 0.82 |
| Exchangeable K | meq 100g dry sub. -1 | 0.24 | 0.20 |
| Exchangeable Na | meq 100g dry sub. -1 | 0.04 | 0.04 |
| Basis saturation | % | 41.29 | 40.14 |
| Ca/Mg rate | 5.17 | 5.20 | |
| Mg/K rate | 3.87 | 3.99 | |
| Assimilable P | mg kg dry sub. -1 | 27.00 | 29.86 |
Yield data from each 19x19m2 mesh plot have been elaborated for the 2012-17 interval (No. 1165 ha-1). Yield repeatability was calculated as a Pearson correlation of the plot-yields within field between consecutive years. Several mixed models (PROC MIXED by SAS 9.0), concerning the yield and NDRE, were applied to the statistical parameters of the fields, whereby the effects of the field or cultivar were considered fixed and the year was taken as the random factor in order to estimate the linear trend. Conversely, when the years were considered fixed, and the fields were considered as the random factor, a least squares solution was found. The covariation of the variability between the different traits was enhanced by fitting a linear or non-linear regression of the estimates. A Friedman’s test for paired samples was used to compare the yield averages of the farm vs. the regional means 7. In a sample field, over a period of two years, the total N (N-tot), and N divided into N-pre-pi and N-pi, was related to the yield by developing a partial correlation with NDRE.
Place: r12; r13 and r23 then r12.3 = (r12 – r13 * r23) / ((1-r13^2)^.5* (1-r23^2)^.5)).
Place: regression b1/2 = covariance12 / stdev2 ^2; regression b2/1 = covariance 12 / stdev1 ^2 then (b1 * b2) = r12^2.
Results
Global Yield, N and NUE Trends Over the Years.
A yearly increase of +2.3% more than the +0.5% of the regional features (Table 2) pointed out a substantial response from PF practices. For an N supply increment of +0.9%, the NUE increase was +1.7%. The trends appeared nonlinear for all the considered average parameters (Figure 4). It should be noted that the average yields of the farm were 17% above the regional means (P 001).
Figure 4.Nonlinear trends of the total N and Yield over a six year period, compared with the production of NW Italy NW.
| Year | N-total | Yield | NUE | NW Italy yield |
| kg ha-1 | t ha-1 | kg N kg-1 | t ha-1 | |
| 2012 | 165.0 | 7.47 | 45.30 | 6.80 |
| 2013 | 167.0 | 7.62 | 45.63 | 6.63 |
| 2014 | 165.0 | 7.65 | 46.38 | 6.44 |
| 2015 | 160.8 | 7.70 | 47.88 | 6.67 |
| 2016 | 162.2 | 8.21 | 50.60 | 6.77 |
| 2017 | 184.3 | 8.36 | 45.39 | 6.92 |
| Mean | 167.4 | 7.84 a | 46.9 | 6.70 b |
| Trend\year | 1.58 | 1.63 | 0.8 | 0.8 |
| Linear trend % | 0.9% | 2.3% | 1.7% | 0.5% |
| P.value linear | 0.053 | 0.009 | 0.063 | 0.213 |
| P.value quadratic | 0.033 | 0.067 | 0.214 | |
| P.value cubic | 0.023 | 0.192 |
Yield Trend and Variability
The statistics of the yield of the single plots confirmed the +2.3% year-1 trend(Table 2), but a very highly significant regression coefficient was observed (P = 0.0002). The variability of the yield appeared to increase over the years, in terms of the standard deviation (+7.3%), coefficient of variation (+5.4%) and range (+7.1%), and only the minimum was stable. A nonlinear shape of the standard deviation is apparent in Figure 5, where a positive and a negative peak can be observed to have affected the performances in 2013 and 2014, respectively. The repeatability of the yield was below 0.10 in 2012, but after a yearly increase of some 8.3%, it reached a value of 0.35 in 2017. As can be observed in Figure 6 a co-evolution of the coefficient of variation and of the repeatability is apparent, with a departure from linearity in 2014. (Table 3)
Figure 5.Trend of yield statistics over the years.
Figure 6.Co-evolution of the coefficient of variation with the plot repeatability of yield.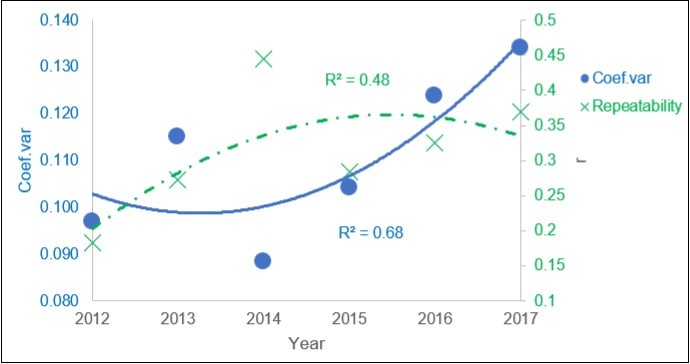
| Mean | St.dev | Coef.var | Max | Min | Range | Repeatability | |
| 2012 | 7.48 | 0.85 | 0.10 | 8.91 | 5.19 | 3.58 | 0.183 |
| 2013 | 7.62 | 1.05 | 0.12 | 9.24 | 4.94 | 4.13 | 0.273 |
| 2014 | 7.65 | 0.82 | 0.09 | 8.86 | 5.16 | 3.56 | 0.445 |
| 2015 | 7.70 | 1.02 | 0.10 | 8.93 | 4.62 | 4.28 | 0.284 |
| 2016 | 8.21 | 1.17 | 0.12 | 9.61 | 4.94 | 4.67 | 0.325 |
| 2017 | 8.36 | 1.26 | 0.13 | 10.01 | 4.84 | 5.20 | 0.370 |
| Mean | 7.84 | 1.03 | 0.11 | 9.26 | 4.95 | 4.24 | 0.313 |
| P.value Means | 0.0073 | 0.0004 | 0.0247 | 0.0212 | 0.7794 | 0.0032 | 0.002 |
| Trend year-1 | 0.179 | 0.075 | 0.006 | 0.191 | -0.065 | 0.299 | 0.026 |
| Trend % | 2.3% | 7.3% | 5.4% | 2.1% | -1.3% | 7.1% | 8.3% |
| P.value linear | 0.0002 | 0.0003 | 0.0164 | 0.0071 | 0.3633 | 0.0003 | 0.0184 |
| P.value quadratic | 0.224 | 0.147 | 0.200 | ||||
| R2 adj | 0.824 | 0.525 | 0.463 | 0.494 | 0.164 | 0.712 | 0.125 |
NDRE Trend and Variability
The NDRE trend grew by +3.0% year-1 (P =0.044), with significantly different annual values (P =0.000; Table 4 and Figure 7).
Figure 7.Trend of the NDRE statistics over a six year period.
| Year | Mean a | St. dev | Coef. Var a | Max | Min | Range |
| 2012 | 0.254 | 0.032 | 0.136 | 0.319 | 0.194 | 0.157 |
| 2013 | 0.295 | 0.033 | 0.140 | 0.375 | 0.227 | 0.215 |
| 2014 | 0.311 | 0.031 | 0.100 | 0.361 | 0.231 | 0.150 |
| 2015 | 0.316 | 0.037 | 0.119 | 0.370 | 0.212 | 0.214 |
| 2016 | 0.290 | 0.032 | 0.113 | 0.347 | 0.195 | 0.163 |
| 2017 | 0.317 | 0.035 | 0.115 | 0.354 | 0.236 | 0.181 |
| Mean | 0.297 | 0.033 | 0.121 | 0.354 | 0.216 | 0.180 |
| P.value Mean | 0.000 | 0.032 | 0.290 | 0.027 | 0.195 | 0.027 |
| Trend year-1 | 0.009 | 0.001 | -0.005 | 0.003 | 0.003 | 0.001 |
| Trend % | 3.0% | 3.0% | -4.1% | 0.8% | 1.4% | 0.6% |
| P.value | 0.044 | 0.240 | 0.833 | 0.054 | 0.355 | 0.077 |
The SD spanned the years (P =0.032) and rose by +3% (not significant) with an important rise in 2015.
The coefficient of variation did not fluctuate over the years, but highlighted a descending parabolic trend (P =0.05.
The Minimum remained stable over the years, while the range and the maximum oscillated (P =0.027), but tended to increase by 1.2% year-1, following a nonlinear shape.
Yield and NDRE Co-Evolution
The co-evolution of the two variables was apparently null (Figure 8). However, when two anomalous years, namely 2012 (excessively homogenous) and 2017 (excessively variable) were excluded, the regression clearly appeared negative: a higher NDRE led to a less variable production.
Figure 8.Yearly regression of the coefficient of variation of the yield on the NDRE values, with outliers for the two years.
NDRE in the Cultivars
The vegetation vigour NDRE statistics of fifteen cultivars grown in Italy are reported in Table 5. The Selenio records were outliers.
Table 5. The vegetation vigour NDRE cultivar statistics over the six year period (No. 46 from 289 averages ha-1 of the elementary observations of two OptRx sensors that followed parallel paths in the fields)| Cultivar | Mean | St. dev | Max | Min | Range | Coef. variation |
| ALLEGRO | 0.201 | 0.025 | 0.283 | 0.137 | 0.183 | 13% |
| CARNISE_ | 0.262 | 0.024 | 0.341 | 0.168 | 0.141 | 10% |
| RONALDO | 0.285 | 0.033 | 0.381 | 0.142 | 0.202 | 12% |
| LEONARDO | 0.299 | 0.029 | 0.398 | 0.231 | 0.199 | 10% |
| GLORIA | 0.307 | 0.027 | 0.371 | 0.197 | 0.166 | 9% |
| MARE | 0.312 | 0.028 | 0.375 | 0.239 | 0.117 | 10% |
| DUCATO | 0.315 | 0.028 | 0.352 | 0.212 | 0.148 | 9% |
| CL26 | 0.319 | 0.038 | 0.407 | 0.188 | 0.224 | 12% |
| TERRA | 0.321 | 0.031 | 0.387 | 0.199 | 0.219 | 10% |
| KRISTALL | 0.325 | 0.028 | 0.380 | 0.221 | 0.159 | 9% |
| DARDO | 0.333 | 0.036 | 0.409 | 0.197 | 0.192 | 11% |
| SIRIO_CL | 0.333 | 0.035 | 0.419 | 0.193 | 0.199 | 11% |
| SOLE | 0.334 | 0.028 | 0.403 | 0.272 | 0.116 | 9% |
| SELENIO | 0.336 | 0.109 | 0.397 | 0.223 | 0.189 | 31% |
| CENTAURO | 0.346 | 0.034 | 0.431 | 0.178 | 0.206 | 10% |
| Prob. | <.0001 | <.0001 | 0.0008 | 0.0084 | 0.1262 | <.0001 |
Nitrogen – Yield Correlations.
As shown in Figure 9, the N-pre-PI and the NDRE in the sample field, which is composed of 311 plots, are not related. In that year (2018), the N-pre-PI was distributed twice according to the 2017 production maps. Instead, the N-PI was administered in a strong negative correlation with the NDRE of each plot (r –0.92; Table 6), and is clearly visible in Figure 10. However, the Yield was not related to N-pre-PI (-0.19), but was negatively related to N-PI (-0.58) and N-tot (-0,38), while it was overall positive for NDRE (R2= 0.29, Figure 7; r=0.54 Table 6).
Figure 9.A -null-relationship example between NDRE and N pre-pi.
Figure 10.A strong negative regression of N-PI on the NDRE value, and a mild positive relationship between NDRE and Yield.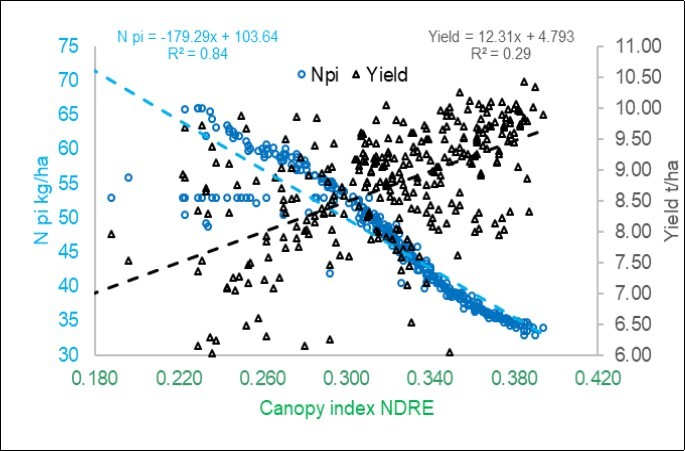
| Items | Means | St. dev. | Coef. Var | Pearson Correlations | |||
| 2017 | N-0 | N-PI | N-Tot | NDRE | |||
| Yield | 9.5 | 0.753 | 7.9% | 0.02 | -0.11 | -0.04 | 0.14 |
| NDRE | 0.318 | 0.026 | 8% | 0.23 | -0.93 | -0.25 | 1 |
| N-pi | 63 | 6.9 | 11% | 1 | 0.30 | ||
| N-0 | 143 | 13.1 | 9% | ||||
| N-tot | 206 | 13.4 | 7% | ||||
| N-pi/N-0 | 30% | ||||||
| NUE | 21.70 | ||||||
| Yield,N .NDRE | 0.06 | -0.01 | |||||
| 2018 | Yield | N-0 | N-pi | N-tot | NDRE | ||
| Yield | 8.7 | 1.013 | 11.6% | -0.19 | -0.58 | -0.38 | 0.54 |
| NDRE | 0.319 | 0.045 | 14% | -0.16 | -0.92 | -0.47 | 1 |
| N-pi | 47 | 8.7 | 19% | 1 | 0.50 | ||
| N-0 | 118 | 20.7 | 18% | ||||
| N-tot | 164 | 23.7 | 14% | ||||
| N-pi/N-0 | 28% | ||||||
| NUE | 18.85 | ||||||
| Yield,N .NDRE | -0.22 | -0.17 | |||||
In Figure 11, a parabolic regression of the yield on N-tot (in violet) shows that a maximum yield-zone was attained. Nevertheless, the points in red below the trajectory indicate sparse areas of nitrogen inefficiency.
Figure 11.Regression of the Yield on N-pi and N-total and regression of the NDRE on the N-total.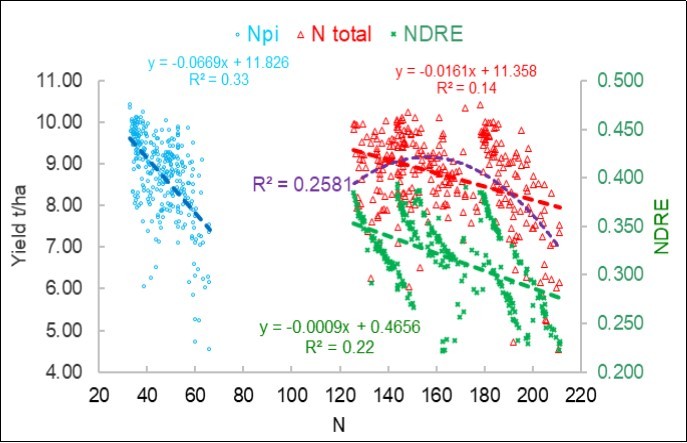
Discussion
Repeatability Model.
The first lesson learned from the farm was that there was a low repeatability of parcel yields in subsequent years. Since this parameter is independent of the operators, it is generally neglected. The PA capabilities can now be used to monitor the parcel responses at a capillary level, thus parcel repeatability could be considered by means of algorithms, especially considering that its positive evolution seems to follow the increase in variability. In fact, a perfect PA aims to a strong homogeneity in parcel production, ergo a zero-correlation between the O/I framework. The germinability of the seeds for flooded rice production is a very critical point, and a variable steam density may affect the yield 4,5
Variability Increase.
The second lesson pertained to the increase in variability of the yield and, to a lesser extent, in NDRE after that a strong negative correlation (< -0.90) was imposed on the N-pi variable fertilization, as inversely proportional to the vegetative vigour attained near PI. Cordero et al 8 in a two-year study on experimental plots fertilized at 0÷300 N-tot, have recently proposed a more refined but similar inverse function to establish the acceptable reduction relative to the maximum obtainable yield. In a study on sugarcane 9, the biomass was the main crop parameter that influenced canopy sensor readings, because biomass readings generally result in stalk yields. Thus, canopy sensor readings can efficiently predict relative sugarcane yields when data that are normalized to the mean of the field are considered. Hence, an algorithm that considers this relationship was established, based on an r -0.68 correlation between NDRE and its coefficient of variation, which was lower than the -0.33 of the present work. However, the NDRE in the 16 sugarcane plots was positively correlated with the yield (+0.82), so that the N topdressing was calibrated in positive vs. NDRE, and not in negative as in the present work. Thus an increase in NDRE should reduce the yield variability, but this has not yet been observed in real fields.
The improvement of the mean and maximum yields, and not of the minimum, depends on several plots where the limiting factor cannot be referred to the N availability. A next challenge will be to check the repeatability for yield in those critical plots and to find which is the limiting factor, or, more simply, to reduce the N rate, avoiding a waste.
N Correlations.
The third lesson concerned the negative correlation between N-tot and yield, which resulted even after absorbing the N-pi in the N-tot. In the experimental plot studies, the correlations were generally positive, and even very high, until the maximum yield was reached 5,8 but results from the real fields are much less optimistic: i.e. Zavattaro et al 10 observed a sparse regression (+0.0125 t kgN-tot-1) of the yield (avg. 6.55 t ha-1) on the N-tot (121.6 kg ha-1) for seven variety groups from 67 land units in NW Italy, where the correlation coefficient was recalculated to r 0.26; the average NUE, compared to the present work, was 54 kg kg-1,that is,an increased value of 15%, while the N-tot and yield appeared reduced by 27% and 16%, respectively.
A local relativity.
The fourth lesson is related the uncertainty of the reference parcels which identified at zero- input 11, or at well-fertilized input5 or by a corrective sufficiency index 8,5, which are necessary to set up the production models and the PA. As shown in Figure 9, the NDRE response over different N-pre-pi was highly variable, that weakens the right point of reference.
The NDRE variability also depends to a great extent on the cultivar, and on the evolution of the temperature and light intensity of the growing season, and it is therefore not automatic to apply the correlation between NDRE and the N rate for PI fertilization of the previous years. The empirical method applied till now on the farm is: i) to consider the prescription threshold table applied in the same cultivar in the previous years; ii) to detect by a drone the gross average NDRE for this cultivar in the current year, and iii) to adapt the prescription threshold table to this parameter. It could also be useful to adapt the N rates to the weather forecast for the following 40 days, if it could be considered reliable.
Conclusions
The study is detached from the usual basic models and applications of the PA, but unfortunately there are no detailed references of similar duration and width to be compared. However, PA is about, and interesting lessons, derived from real and not from model domain, featured the evolution of high production rice fields. The PA on this farm increased the yield for the same total input of N, but also its variability was increased – and not reduced, as predicted by the theory – but strengthening the repeatability, a neglected parameter.
The present elaborations of field parcel data suggest that the actual applied N rates are near, or over, the maximum of the parabolic curve that represents the non-linear correlation between N-tot and Yield. Slightly reducing the maximum N rates would probably not affect the maximum yields.
In order to reduce the variability of NDRE and of the yields, the first factor that must be considered is the plant density: having an even density of between 200 and 250 plants m-2 should be the key to improving the results (Figure 12)
Figure 12.An example of high variability in the number of plants (up) and panicles (down) per square meter, manually measured in the same sites, with the help of a GPS portable device.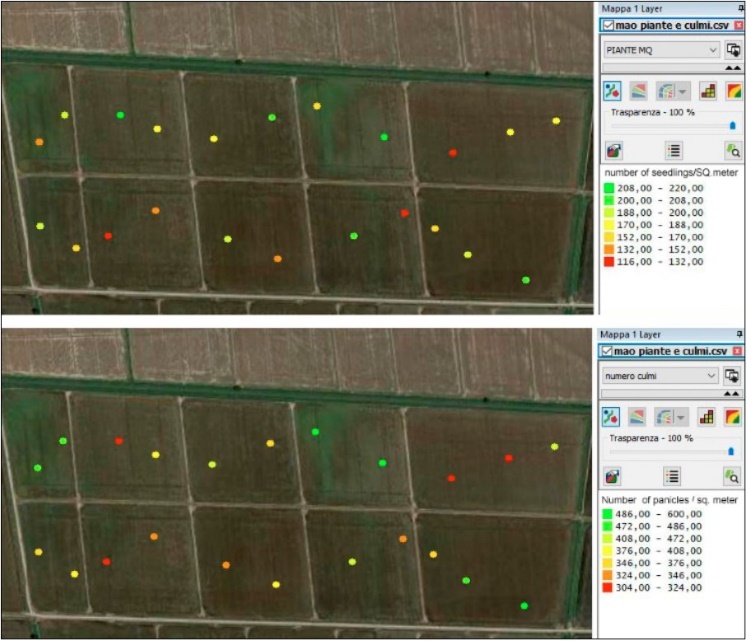
An advantage of the reduction in the N rates at PI, where NDRE is already high, is a reduction in the risk of attacks of Pyriculariagrisea, a fungal disease that is increased by N excesses. This advantage is very complex to be estimated in a farm environment.
All over the paper we have deliberately avoided representing maps of vigor and minute details of production and N-supply. The fact that the repeatability was barely +0.31 over 6 years indicates that the soil factor & N-pre-pi explains less than 10% of the variability, so we would have shown a 90% noise in the maps
This paper underlines that PA still has a huge potential that still must be explored.
Acknowledgments
The authors wish to thank the Fondazione CRT, Torino – Italy, for the financial support to the scientific activities of the “Accademia di Agricoltura di Torino”.
References
- 1.Confalonieri R, Bocchi S. (2005) Evaluation of CropSyst for simulating the yield of flooded rice in northern Italy.European journal of agronomy23. 315-326.
- 2.Balasubramanian V, Alves B, Aulak M, Bekunda M, Cai Z et al. (2004) Crop, environmental,and management factors affecting nitrogen use efficiency. , Agriculture and the Nitrogen Cycle,edited by Mosier AR, Syers J K, Freney J,SCOPE 65, 19-33.
- 3.Brisson N, Gary C, Justes E, Roche R, Mary B et al. (2003) An overview of the crop model STICS. , European Journal of agronomy 18, 309-332.
- 4.Hirzel J, Pedreros A, Cordero K. (2011) Effect of nitrogen rates and split nitrogen fertilization on grain yield and its components in flooded rice.Chilean. , Journal of Agricultural Research,71 437.
- 5.Xue L, Li G, Qin X, Yang L, Zhang H. (2014) Topdressing nitrogen recommendation for early rice with an active sensor in south China.Precision. Agriculture,15 95-110.
- 6.Pallottino F, Biocca M, Nardi P, Figorilli S, Menesatti P et al. (2018) Science mapping approach to analyze the research evolution on precision agriculture: World. EU and Italian situation.Precision Agriculture,19 1011-1026.
- 7.ISTAT. (2018) Superficie (ettari) e produzione (quintali). http://agri.istat.it/jsp/dawinci.jsp?q=plC020000010000011000&an=2013&ig=1&ct=244&id=15A|18A|25A
- 8.Cordero E, Moretti B, E F Miniotti, Tenni D, Beltarre G et al. (2018) Fertilisation strategy and ground sensor measurements to optimise rice yield. , European Journal 99, 177-185.
- 9.L R Amaral, J P Molin, J S Schepers. (2015) Algorithm for variable-rate nitrogen application in sugarcane based on active crop canopy sensor.Agronomy. , Journal 107, 1513-1523.
Cited by (3)
- 1.Castano-Duque Lina, Avila Angela, Mack Brian M., Winzeler H. Edwin, Blackstock Joshua M., et al, 2025, Prediction of aflatoxin contamination outbreaks in Texas corn using mechanistic and machine learning models, Frontiers in Microbiology, 16(), 10.3389/fmicb.2025.1528997
- 2.Santoso Agung B., Ulina Evawaty S., Batubara Siti F., Chairuman Novia, Sudarmaji , et al, 2024, Are Indonesian rice farmers ready to adopt precision agricultural technologies?, Precision Agriculture, 25(4), 2113, 10.1007/s11119-024-10156-7
- 3.Fita David, Rubio Constanza, Uris Antonio, Castiñeira-Ibáñez Sergio, Franch Belén, et al, 2025, Remote Sensor Images and Vegetation Indices to Optimize Rice Yield Analysis for Specific Growth Stages Within Extensive Data, Applied Sciences, 15(7), 3870, 10.3390/app15073870