
Reduced Tissue Oxygenation and Altered Valsalva Hemodynamics in Young Adults with Type 1 Diabetes

Abstract
Aims
Cardiac autonomic neuropathy is currently an untreatable progressive complication of type 1 diabetes (T1D). Impaired microcirculation is a suspected cause of nerve degeneration in TID. We investigated whether cardiovascular autonomic reflexes often used as indices of nerve functions, are associated with indices of microcirculatory function in young adults with T1D compared with non-diabetic controls.
Methods
In a cross-sectional study, 15 adults with T1D and 15 age-matched controls (20-40 years) underwent standardized cardiovascular autonomic reflex tests. Continuous recordings of electrocardiogram, cardiac vagal tone, beat-to-beat blood pressure and transcutaneous tissue oxygen (tcpO₂) and carbon dioxide partial pressures (tcpCO2) were done.
Results
Despite preserved baroreflex, parasympathetic, and sympathetic functions assessed using cardiovascular reflex tests, the individuals with T1D exhibited reduced baseline tcpO2 compared to the controls (37.5±3.75 vs. 49.6 mmHg). During the Valsalva manoeuvre, individuals with T1D exhibited a reduced systolic blood pressure response in phase I (31±10 vs. 43±18 mmHg) and early phase II (-1±15 vs. -18±17 mmHg), and an increased systolic (31±15 vs. 18±14 mmHg) and diastolic (45±11 vs. 33±16 mmHg) response in late phase II compared to controls. The early phase II diastolic response was inversely associated with baseline tcpO2.
Conclusion
The altered hemodynamic response to the Valsalva manoeuvre is suggestive of possible reduced arterial elasticity, higher vascular resistance, and splanchnic sympatho-vagal imbalance in T1D despite normal autonomic reflex ratios. The concomitant evidence of reduced tissue oxygenation and altered hemodynamics may represent early signs of dysautonomia but require longitudinal validation.
Article Information
- Received
- Accepted
- Published
Academic Editor: Ian James Martins, Principal Research Fellow Edith Cowan University
Checked for plagiarism: Yes
Review by: Single-blind
Copyright © 2026 Maria Bitsch Poulsen, et al.
 This is an open-access article distributed under the terms of the Creative Commons Attribution License, which permits unrestricted use, distribution, and reproduction in any medium, provided the original author and source are credited.
Corresponding author: Christina Brock, Mech-Sense, Department of Gastroenterology, Aalborg University Hospital, Gistrup, Denmark, Department of Clinical Medicine, Aalborg University, Gistrup, Denmark —
Competing Interests
The authors declare no potential conflict of interest concerning the research, authorship, and publication of the article.
Funding
This study was supported by a grant from A.P. Møller Mærsk Fonden.
Data Availability
Data and code are available upon reasonable request
Citation:
Introduction
Cardiovascular autonomic neuropathy (CAN) is a common microvascular neuropathic condition among individuals with type 1 diabetes (T1D). According to epidemiological studies, the prevalence of CAN ranges from 36 to 44 %, and they are commonly associated with reduced quality of life1, 2, 3. Alarmingly, CAN has been observed in adolescents with T1D, with up to 32% showing early signs of CAN4, 5. This highlights the early onset and clinical relevance of this complication.
The prevailing understanding of the development of diabetic neuropathy is that it is length dependent, affecting e.g. sensorimotor nerves in the extremities first, or the relatively long vagus nerve6. Affection of the vagus nerve manifests as parasympathetic withdrawal, which is considered a potentially reversible stage of autonomic dysfunction7, 8. The gold standard for diagnosing CAN is the Ewing's test battery, also known as cardiovascular autonomic reflex tests (CARTs)9, where especially the expiration-to-inspiration (E:I) ratio is primarily parasympathetically driven10. However, its utility in detecting parasympathetic withdrawal may be limited by methodological inconsistencies11. These include variations in body position (supine vs. seated), the relative duration of expiration to inspiration to ranging from 1:1 to 3:1, and how the E:I ratio is calculated, either by averaging the longest and shortest RR-intervals from each breathing cycle or by selecting the single longest and shortest RR-intervals across all cycles. Together, these methodological variations reduce reliability and increase the risk of misclassification, particularly in early, subtle, or borderline cases.
Although the standardized CARTs evaluate both RR-interval and blood pressure responses, clinical applicable practice increasingly emphasizes solely on RR-interval-based measures, potentially overlooking vascular abnormalities. The endothelium plays a critical role in the regulation of vascular tone, and studies have reported endothelial dysfunction even in uncomplicated T1D12. This can contribute to altered vascular reactivity, which may alter hemodynamic responses during autonomic challenges, particularly those requiring rapid vasomotor adjustments, such as the Valsalva manoeuvre. Altered microvasculature with localized tissue hypoxia, might represent one of the earliest pathophysiological steps in the development of diabetic neuropathy13, and could serve as an early indicator of autonomic dysfunction, potentially preceding detectable changes in traditional nerve-based measures such as cardiac adaptability assessed as RR-interval responses.
We hypothesize that the tissue metabolism is altered in T1D leading to increased use of oxygen compared to controls. Thus, the purpose of this study was to assess cardiovascular autonomic function (ECG/RR-interval and blood pressure responses) and tissue metabolism of transcutaneous oxygen and carbon dioxide, as well as their associations, in younger adults with T1D compared with healthy controls.
Methods
The study was approved by the local Ethics Committee in the North Denmark Region (N-20230033) and informed consent was collected. It was registered with the Regional Data Security Authority (ID no. F2023-097).
Participants
This non-blinded cross-sectional study constituted 15 adults with T1D and 15 age-matched non-diabetic controls aged between 20-40 years. Individuals were excluded if they had blood pressure >150/90, known cardiovascular or neurological disorders, known with frequent syncopal episodes (>3 events in the past year), used strong analgesics, sedative antihistamines, or received systemic corticoid treatment within 5 weeks of inclusion. The individuals with T1D were required to have had the condition for at least 5 years and to receive stable anti-diabetic and anti-hypertensive treatment for a minimum of 4 weeks prior to inclusion.
Cardiovascular autonomic assessment
The participants underwent comprehensive testing of the cardiovascular autonomic reflexes to assess the integrity of both the parasympathetic and sympathetic nervous systems. The testing protocol included massage of the carotid sinus, a one-minute cycle of deep breathing (4 seconds in, 6 seconds out) in the supine position, the response to active orthostasis (transition from seated on a low stool to standing upright), a 3-minute isometric handgrip at 50% of the maximum sustainable force, and the Valsalva Manoeuvre (repeated three times for practice), where a forced exhalation against resistance with an open epiglottis was maintained for 15 seconds at an intra-thoracic pressure of 40 mmHg. Throughout all tests, continuous recordings were obtained with the NeuroScope (NeuroSentronics Ltd, London, UK) by recording electrocardiogram (ECG) at 5000 Hz, real-time ECG-derived cardiac vagal tone (CVT) measured in linear vagal scale units (LVS), and respiratory frequency and rhythm. Beat-to-beat blood pressure was measured with the Nexfin® (BMEYE, Amsterdam, NL), which, in combination with the NeuroScope, enabled assessment of the cardiac sensitivity to the baroreflex. Transcutaneous levels of oxygen (tcpO₂) and carbon dioxide (tcpCO₂) levels was obtained using the TCM5 Flex (Radiometer, Copenhagen, DK). The NeuroScope methods of autonomic assessment is previously published elsewhere14.
From medical records, the following was extracted: The latest glycated haemoglobin (HbA1C), use of treatment aids such as insulin pumps and continuous glucose monitoring, presence of complications, and the latest assessment of the peripheral nervous system. To assess the symptom burden, the participants completed the validated Danish version of the Composite Autonomic Symptom Score 31 (COMPASS-31), which is a 31-item questionnaire covering different autonomic domains15. It was scored according to Sletten’s method16.
Reflex analysis
To determine the integrity of the baroreflex, the maximum CVT and minimum systolic blood pressure response to carotid sinus massage was extracted. A minimum increase by 5 units on the LVS of CVT is considered a normal cardiodepressor response, and >20 is higher than normal response, and a minimum of 10 mmHg decrease in systolic blood pressure is considered a normal vasodepressor response, and >30 is higher than normal response14.
To assess the central parasympathetic response to deep breathing, the maximum levels of CVT, oxygen tension (tcpO₂) and minimum level of carbon dioxide tension (tcpCO₂) during 60 seconds of deep inspirations to maximum lung capacity and expirations to the forced expiratory volumes were identified and used for the analyses. To calculate the E:I ratio, the shortest and longest RR-interval during these respiratory manoeuvres were selected to capture peak parasympathetic modulation. The transcutaneous measurements of tcpO2 and tcpCO2 were used to assess microcirculatory function by quantifying the O2 influx into tissues and CO2 efflux from tissues during the 60 seconds respiratory manoeuvres.
For the active orthostasis test, the shortest RR-interval around the 15th beat and the longest RR-interval around the 30th beat after standing upright were selected to calculate the 30:15 ratio. Furthermore, blood pressure responses were monitored and followed for 3 minutes. Sustained orthostatic hypotension was defined as a decrease in systolic blood pressure ≥20 mmHg or diastolic blood pressure ≥10 mmHg from the resting value, based on the average pressure measured between second and third minute after standing.
In the sympathetic driven 3-minute isometric handgrip test, the mean values of RR-intervals, heart rate, blood pressure, tcpO₂, and tcpCO₂ derived from 20 beats before the procedure was initiated were compared to the last 20 beats during the procedure. The cardioaccelerator function was categorised as normal if the heartrate increased by at least 22%. The central baroreflex responsiveness was defined as the difference in RR-intervals divided by the difference in systolic blood pressure, which was compared to the predicted baroreflex (2.42*103*height-5) and categorised as lower, normal or higher than predicted central gain17. Similarly, the diastolic blood pressure response was used as a surrogate of central sympathetic vasomotor drive to the total peripheral resistance mostly from the skeletal muscles, and an increase of at least 15 mmHg was regarded as normal14.
The Valsalva ratio was calculated as the longest RR-interval during the rebound phase divided by the shortest RR-interval during positive intra-thoracic pressure. The highest ratio obtained from the performed Valsalva manoeuvres was used in the CAN assessment. For blood pressure analysis, the Valsalva manoeuvre with adequate intrathoracic pressure and distinct physiological phases was selected. The change in early phase II was used as a marker of venous return, a decrease exceeding -25 mmHg from the pre-manoeuvre level was interpreted as reduced venous return. The change in systolic blood pressure in late phase II was used as a marker of the alpha-1 adrenergic autotransfusion in the splanchnic vascular bed, and an increase >15 mmHg was interpreted as exaggerated auto-transfusion14.
To assess the magnitude of the response to the different manoeuvres, each response was compared with a representative resting segment with minimal blood pressure variation shortly before the manoeuvre. To determine CAN status age-adjusted reference values were used18: 1 abnormal test was classified as early CAN and 2+ abnormal test was classified as manifest CAN.
Statistical Analysis
The distribution of continuous variables was examined using Q-Q plots and the Shapiro-Wilk test. Data are presented as mean ± standard deviation (SD) if normally distributed, or as median with interquartile range (IQR) if not. Categorical variables are presented as counts and percentages, and differences in proportions are determined with Fisher's Exact test. Continuous between-group differences were assessed using the independent-samples t-test when the assumption of normality was met, or the Wilcoxon rank-sum test when it was not. Within-subject comparisons (e.g., rest vs. response) were analysed using paired t-tests or Wilcoxon signed-rank tests, as appropriate. Linear regression was used to assess associations between continuous variables. Statistical significance was defined as P < 0.05. Analyses were performed in Stata (StataCorp. 2025. Stata Statistical Software: Release 18. College Station, TX: StataCorp LLC). Figures were generated in R (R Core Team, 2026. R: A Language and Environment for Statistical Computing. R Foundation for Statistical Computing, Vienna, Austria) using the ggplot2 package.
Results
Clinical characteristics
Overall, participants with T1D and controls were comparable across most characteristics, as summarized in Table 1. None of the controls showed signs of CAN, while only one individual with T1D exhibited early CAN, specifically, a slightly reduced Valsalva ratio. Based on review of medical records, none of the T1D participants showed clinical signs of peripheral neuropathy. However, 80% demonstrated evidence of diabetic retinopathy, which was classified as mild in 11 out of 12 cases.
Table 1. Clinical characteristics. SD: standard deviation, IQR: interquartile range, y: year, CGM: continuous glucose monitoring. COMPASS-31: Composite Autonomic Symptom Score 31. HR: heart rate. BP: blood pressure. mmHg: millimetres of mercury. CVT: cardiac vagal tone. LVS: linear vagal scale. CSB: cardiac sensitivity to the baroreflex. *: autonomic baseline measures were obtained in a relaxed supine position.| Control | T1D | P-value | |
| N | 15 | 15 | |
| Age, mean (SD) | 29 (6) | 32 (4) | 0.219 |
| BMI (kg/m3), mean (SD) | 24.7 (6) | 27.3 (5.8) | 0.138 |
| Sex male, N (%) | 8 (53.3) | 6 (40.0) | 0.464 |
| Disease duration (y), mean (SD) | 18.8 (8.3) | ||
| HbA1c (mmol/mol), mean (SD) | 62 (11) | ||
| Treatment aids | |||
| CGM-users, N (%) | 15 (100) | ||
| Duration of CGM-use (y), mean (SD) | 3 (1) | ||
| Insulin pump users, N (%) | 9 (60) | ||
| Duration of pump use (y), mean (SD) | 11 (3) | ||
| Complications | |||
| None, N (%) | 3 (20) | ||
| Retinopathy, N (%) | 12 (80) | ||
| Peripheral sensation | |||
| Vibration perception threshold (Volt), mean (SD) | 9 | ||
| Diminished touch, N (%) | 0 (0) | ||
| Diminished heat/cold, N (%) | 0 (0) | ||
| Diminished proprioception, N (%) | 0 (0) | ||
| CAN status, N (%) | |||
| Early CAN | 0 (0) | 1 (6.7) | 1.0 |
| Manifest CAN | 0 (0) | 0 (0) | |
| Baseline autonomic measures* | |||
| COMPASS-31 score, mean (SD) | 4.8 (4.0) | 14.1 (13.8) | 0.018 |
| HR (bpm), mean (SD) | 67 (11) | 66 (9) | 0.651 |
| Systolic BP (mmHg), median (IQR) | 111 (102; 121) | 114 (108;121) | 0.395 |
| Diastolic BP (mmHg), median (IQR) | 63 (57; 70) | 64 (63; 68) | 0.604 |
| CVT (LVS), median (IQR) | 7.8 (5.9; 13.1) | 6.7 (5.5; 9.8) | 0.310 |
| CSB, mean (SD) | 7.5 (4.3) | 6.1 (2.5) | 0.315 |
| Heart contractility (mmHg/s), mean (SD) | 529 (221) | 508 (143) | 0.762 |
| SpO2, mean (SD) | 97.8 (1.8) | 97.5 (1.2) | 0.583 |
| tcpO2 (mmHg), mean (SD) | 49.5 (15) | 37.5 (3.8) | 0.034 |
| tcpCO2 (mmHg), mean (SD) | 37.5 (3.8) | 40.5 (3.8) | 0.053 |
| O2/CO2 ratio, mean (SD) | 1.4 (0.5) | 0.9 (0.4) | 0.025 |
The individuals with T1D group exhibited higher COMPASS-31 scores, indicating a greater burden of autonomic symptoms. They had normal O2-saturation of the blood but had lower tcpO2 levels and a reduced O₂/CO₂ ratio. Consequently, T1D participants were CO₂-dominant whereas controls were primarily oxygen-dominant suggesting increased tissue metabolism of O2. All individuals with T1D were users of continuous glucose monitoring (CGM) devices, though most had initiated CGM relatively recently, and 60% used insulin pumps.
Carotid Massage
The response to carotid massage is illustrated in Figure 1. The individuals with T1D increased their CVT from 7.4 ± 2.7 LVS to 16.9 ± 7.2 (P<0.001), which corresponds to a 115.6 ± 70.4% increase. Whereas the controls increased their CVT from 10.2 ± 5.0 LVS to 23.0 ± 14.5 (P<0.001), which corresponds to a 128.4 ± 97.6% increase. There was no between-group difference in the relative change or in the maximum CVT (all P>0.05). Categorization of the CVT response (cardiodepressor) revealed no significant difference between groups (P=0.317).
In the individuals with T1D, the systolic blood pressure decreased from 118.9 ± 8.8 mmHg to 105.3 ± 11.5 (P<0.001), corresponding to a change of -9.8 ± 3.8 %. The systolic blood pressure of the controls, decreased from 119.1 ± 17.9 mmHg to 103.9 ± 19.3 (P<0.001), which corresponds to a relative change of -10.3± 9.6%. There was no between-group difference in the relative change or in the minimum systolic blood pressure (all P>0.05). Categorization of the systolic blood pressure response (vasodepressor) revealed no significant difference between groups (P= 0.407). These findings suggest that the baroreflex was intact and functioning appropriately in both groups.
Figure 1. Cardiac vagal tone and systolic blood pressure responses to carotid massage. T1D: type 1 diabetes, BP: blood pressure. 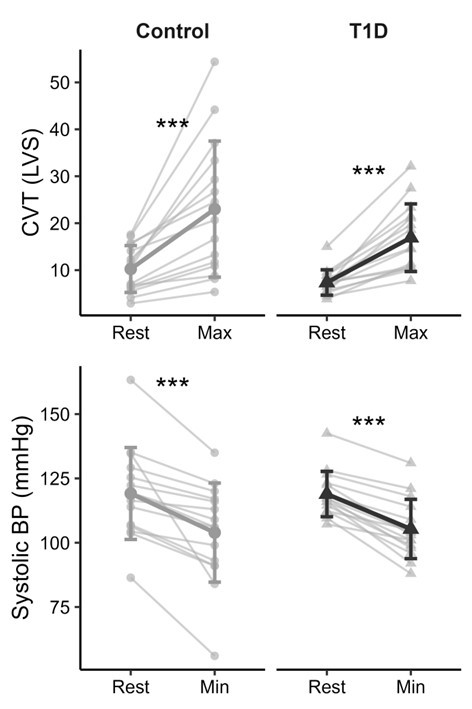
Download figure
Deep breathing
The individuals with T1D had an E:I ratio of 1.56 ± 0.23 compared to 1.68 ± 0.27 for the controls (P=0.206). Moreover, when comparing the mean E:I ratio to the max E:I ratio, the mean was 14 ± 6.8 % lower, indicating that individuals habituate during the one-minute cycle.
The systolic blood pressure and CVT response to deep breathing is visualized in Figure 2. The individuals with T1D showed an increase in their CVT from 7.5 ± 2.7 LVS to 21.8 ± 9.0 (P<0.001), an increase of 198.3 ± 97 %. Similarly, the controls increased CVT from 11.9 ± 6.9 LVS to 29.2 ± 14.5 LVS (P<0.001), corresponding to a 230.3 ± 233% increase. There was no difference in the relative change between the two groups (P=0.630).
The individuals with T1D increased their tcpO2 from 37.3 ± 13.8 mmHg to 40.2 ± 12.8 (P=0.014), corresponding to a relative change of +13.4 ± 29.1%. The controls increased in tcpO2 from 49.5 ± 15.0 mmHg to 51.5 ± 17.3 (P=0.065), corresponding to a relative change of +3.6 ± 5.5%. There was no difference in relative change reflecting the biologic variation in the cohort (P=0.232). The individuals with T1D decreased their tcpCO2 from 40.3 ± 4.0 mmHg to 37.2 ± 4.0 (P=0.013), corresponding to a relative change of -7.9 ± 2.8 %. The controls decreased in tcpCO2 from 37.3 ± 3.9 mmHg to 34.1 ± 3.9 (P<0.001), corresponding to a relative change of -8.5 ± 4.4 %. There was no difference in relative change (P=0.658). The individuals with T1D trended toward a lower maximum tcpO2 response (P=0.059) and had a higher minimum tcpCO2 level (P=0.048) compared to the controls. Thus, there is no evidence of microcirculatory dysfunction, however the preexisting differences prior to deep breathing were maintained during the manoeuvre.
Figure 2. Responses to deep breathing: cardiac vagal tone, oxygen and carbon dioxide levels. T1D: type 1 diabetes, CVT: cardiac vagal tone, tcpO2: transcutaneous oxygen pressure, tcpCO2: transcutaneous carbon dioxide pressure. 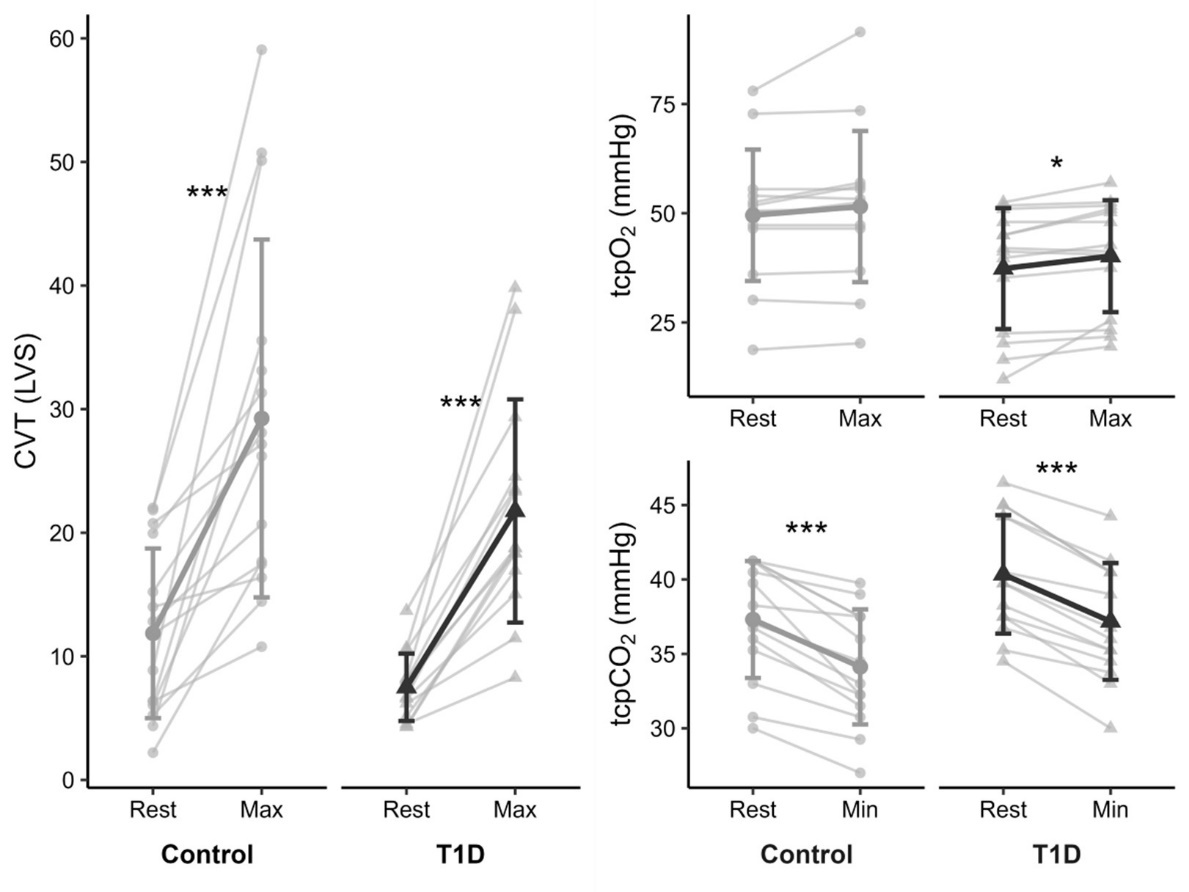
Download figure
Active orthostasis
In response to postural change, the controls and T1D responded similarly, as shown in Figure 3. For the 30:15 ratio, the individuals with T1D had a ratio of 1.50 ± 0.22, and the controls had a ratio of 1.49 ± 0.42 (P=0.384). No differences were observed in RR-interval, heart rate, systolic, or diastolic blood pressure during either the immediate postural response or the stabilisation (all P> 0.05). Sustained orthostatic hypotension was only observed in one control (asymptomatic i.e., reported no dizziness).
Figure 3. RR-interval, heart rate, and blood pressure response to active orthostasis (mean ± standard deviation). RR-interval length was measured in milliseconds, heart rate in beats per minute, and blood pressure in millimetres of mercury, mmHg. BP: blood pressure. R: resting level prior to stand up. Time = 0 is the stand up. 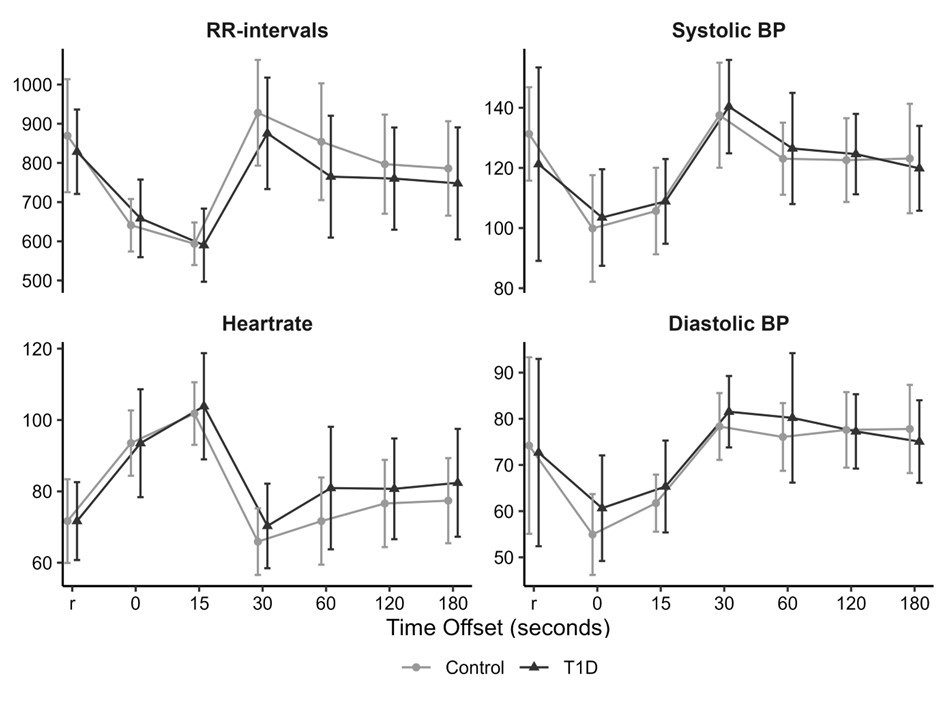
Download figure
Valsalva manoeuvre
The Valsalva ratio was 1.96 ± 0.44 in the individuals with T1D compared to 2.01 ± 0.34 for the controls (P=0.838).
The blood pressure responses to Valsalva manoeuvre can be divided into five distinct phases, and the response to each phase adjusted for the pre-maneuver blood pressure is visualized in Figure 4. In individuals with T1D, phase I was characterized by an increase of 31±10 mmHg in systolic blood pressure and 37±25 mmHg in diastolic blood pressure compared to the pre-manoeuvre level. In early phase II, systolic blood pressure showed a minimal change (-1±15 mmHg), while diastolic blood pressure increased by 16±24 mmHg. In late phase II, systolic and diastolic blood pressure increased by 31±15 mmHg and 45±11 mmHg respectively. During phase III, systolic blood pressure decreased by -14±21 mmHg, while diastolic blood pressure increased slightly (5±14 mmHg). In phase IV, systolic and diastolic blood pressure increased by 41±22 mmHg and 19±16 mmHg, respectively.
In the controls, phase I was associated with an increase of 43±18 mmHg in systolic blood pressure and 34±23 mmHg in diastolic blood pressure. In early phase II, systolic blood pressure decreased by -18±17 mmHg, while diastolic blood pressure showed minimal change (2±14 mmHg). In late phase II, systolic and diastolic blood pressure increased by 18±14 mmHg and 33±16 mmHg respectively. During phase III, systolic and diastolic blood pressure decreased by -21±13 mmHg and -3±20 mmHg respectively. In phase IV, systolic blood pressure increased by 37±26, and diastolic blood pressure by 12±14 mmHg.
The individuals with T1D had reduced systolic response in phase I (P=0.037) and early phase II (P=0.007) as well as elevated systolic and diastolic change in late phase II (P=0.035, P=0.024). There was no difference in the other phases (all P>0.05). The response for early phase II was within the normal range in both groups, whereas the late phase II response was close to the normal range in the controls but markedly exaggerated for the individuals with T1D. In comparison to the controls, the blunted phase II early response in T1D suggests that the venous return was relatively maintained, and the exaggerated late phase II response suggest elevated sympathetic activation with enhanced splanchnic autotransfusion
Moreover, during early phase II, the diastolic blood pressure response was inversely associated with baseline tcpO2, with a decrease of -0.04 mmHg per increase in tcpO2 (P=0.043, R²=0.15). This indicates that lower tissue oxygenation was associated with a larger diastolic blood pressure change from the pre-maneuver-level, reflecting a blunted return of blood pressure toward the pre-maneuver during this phase. This is visualized in Figure 4. No other associations were observed between the phases of the Valsalva manoeuvre and transcutaneous pressures (all P>0.05).
Figure 4. Response during the Valsalva manoeuvre adjusted for the pre-manoeuvre blood pressure. Left: systolic and diastolic blood pressure response across the phases of the Valsalva manoeuvre. Right: Linear regression between absolute values of transcutaneous O₂ (tcpCO₂) and absolute values of diastolic blood response during early phase two (IIe). The dashed lines indicate no change from pre-manoeuvre blood pressure. BP: blood pressure. 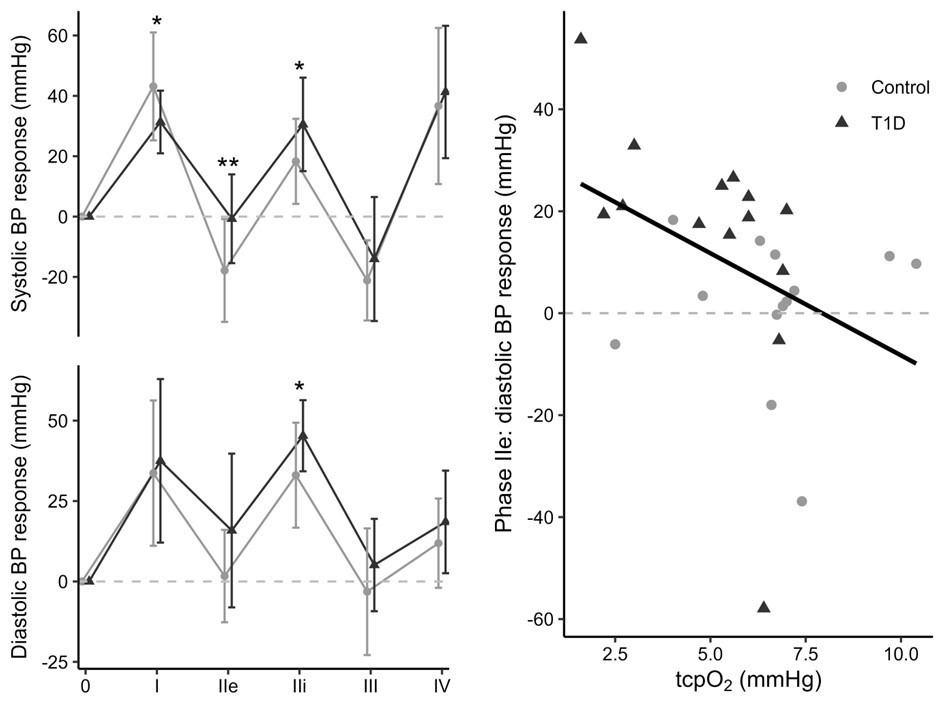
Download figure
Handgrip
In response to a 3-minute handgrip, both the controls and T1D showed signs of an increase in sympathetic activity (Figure 5). The individuals with T1D decreased their RR-intervals from 809 milliseconds (720; 1003) to 624 (539; 711), increased their heart rate from 74 (13) beats per minute to 99 (20), increased their systolic blood pressure from 153 (17) mmHg to 191 (37), increased their diastolic blood pressure from 95 (88; 99) to 119 (106; 133), and increased their tcpO2 levels from 46.5 (33.8; 54.0) to 57.8 mmHg (41.3; 62.3). All P >0.001. No change in tcpCO2 was observed (P>0.05)
Similarly, the controls decreased their RR-intervals from 868 milliseconds (835; 911) to 574 (525; 717), increased their heart rate from 70 (10) beats per minute to 103 (22), increased their systolic blood pressure from 137 (31) mmHg to 185 (19) mmHg, increased their diastolic blood pressure from 92 (88; 99) mmHg to 116 (112; 130) mmHg, and increased their tcpO2 levels from 59.3 mmHg (52.5; 72.8) to 66.8 mmHg (63.8; 75.8). All P > 0.001. No change in tcpCO2 was observed (P>0.05).
There was no significant difference in cardioaccelerator function, baroreflex responsiveness, or sympathetic vasomotor drive during the handgrip test when participants were grouped by the categorized variable (all P>0.05). When comparing the relative change, there was no difference between individual with T1D and controls in any of the measures (all P>0.05). Thus, the comparison suggests that autonomic cardiovascular responses to the handgrip test were similar between the T1D and controls.
The individuals with T1D maintained a lower tcpO2 and higher tcpCO2 throughout the handgrip compared to the controls. In T1D, the pre-handgrip tcpO2 was lower in T1D compared to the controls (46.5 (33.8; 54.0) vs. 59.3 (52.5; 72.8) mmHg, P = 0.006) and remained lower at the end of the handgrip (57.8 (41.3; 62.3) vs. 66.8 (63.8; 75.8) mmHg, P = 0.004), despite increasing to the pre-handgrip level observed in controls. In contrast, tcpCO2 was higher in T1D both before the handgrip (39.0 ± 3.3 vs. 36.1 ± 4.1 mmHg, P = 0.045) and at the end of the handgrip (38.8 ± 3.8 vs. 35.7 ± 3.7 mmHg, P = 0.037).
Figure 5. RR-interval, heartrate, blood pressure, oxygen and carbon dioxide response to a 3-minute handgrip test. RR-interval length was measured in milliseconds, heartrate in beats per minute. Blood pressure, oxygen and carbon dioxide were measured in mmHg. BP: blood pressure. tcpO2: transcutaneous oxygen pressure, tcpCO2: transcutaneous carbon dioxide pressure. T1D: type 1 diabetes.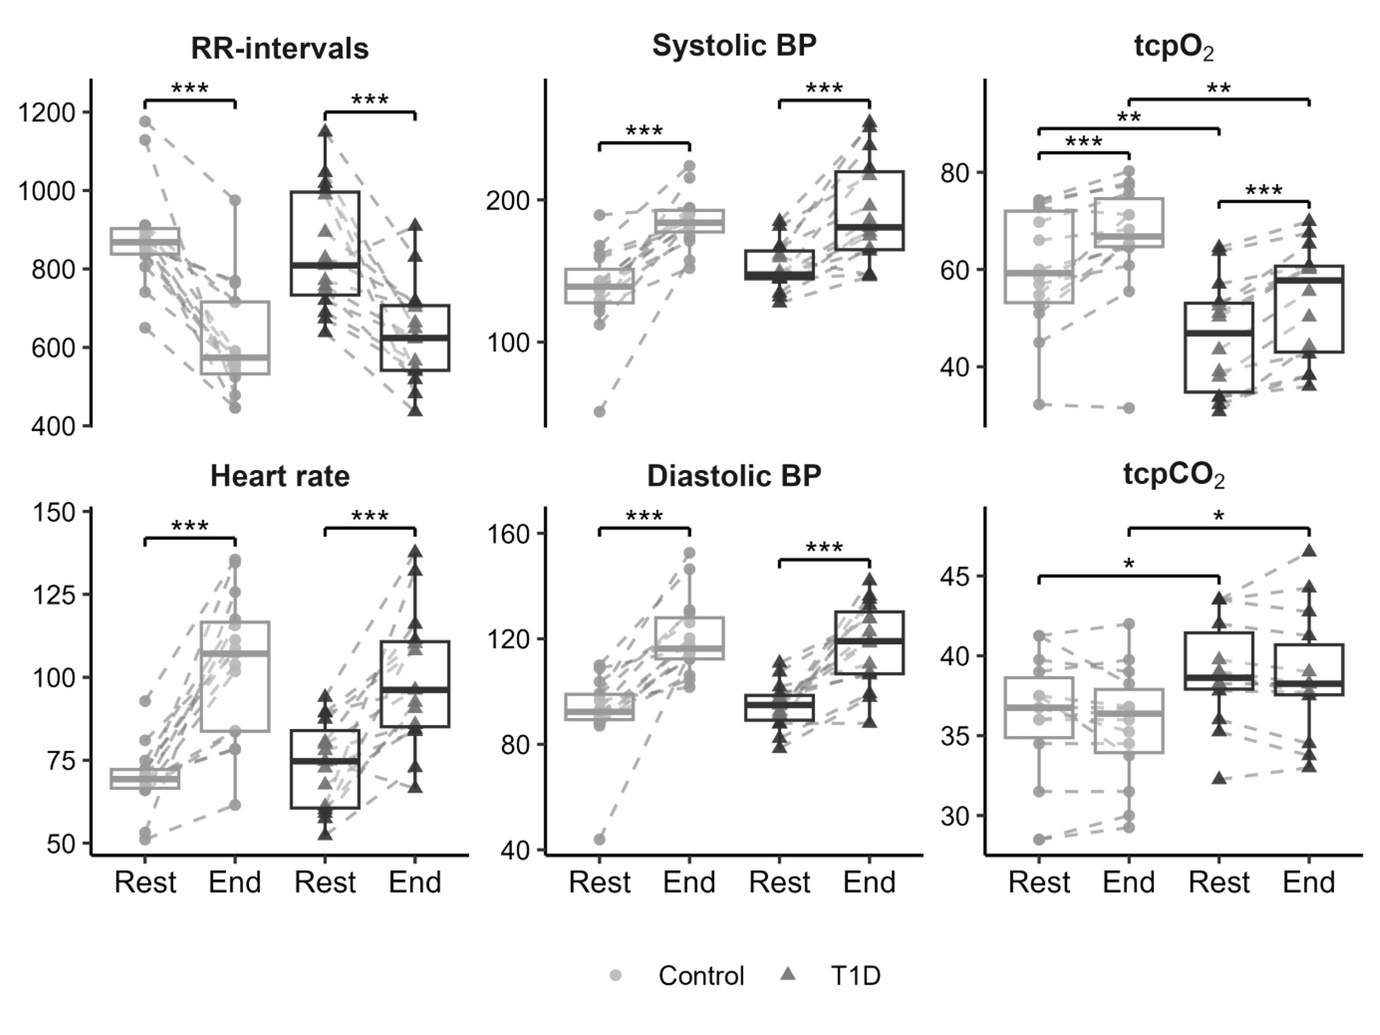
Download figure
Discussion
Individuals with T1D without autonomic or peripheral neuropathy exhibited reduced tissue oxygenation despite normal systemic oxygen saturation. During the Valsalva’s manoeuvre, the individuals with T1D showed a reduced systolic blood pressure response in phase I and early phase II, as well as an exaggerated response in both systolic and diastolic blood pressure in late phase II. The exaggerated systolic blood pressure in late phase II responses may reflect a hyperadrenergic state with enhanced splanchnic autotransfusion. These findings point to possible sympatho-vagal imbalance, despite normal results on standard autonomic function tests.
Chronic hyperglycemia sets off a cascade of events leading to pathological alterations in neurons, glia cells and microvasculature, ultimately leading to nerve dysfunction, and progressive tissue hypoxia is likely to exacerbate this. Thereby compromising tissue perfusion, promoting oxidative stress and inflammation, over time leading to ischemia of the surrounding tissue. Structural vascular changes, including basement membrane thickening and altered capillary density, support the presence of diabetes-induced nerve ischemia19. In the present study, individuals with T1D exhibited reduced tcpO₂ despite normal systemic oxygen saturation, suggesting altered tissue oxygen metabolism, low tissue perfusion, or a combination. These findings imply that, in T1D, tissue requires higher oxygen availability to achieve the same functional or metabolic effect as observed in controls, or alternatively, reduced tissue perfusion. The borderline elevation in tcpCO₂ may indicate increased local CO₂ production, potentially reflecting a shift toward greater lipid oxidation compared with controls. These findings are consistent with the results of Breuer 198820. The presence of reduced tissue oxygenation with normal CARTs ratio aligns with the presumption that microvascular changes may develop early in the disease course, often within the first five years of T1D6, 21. Since reduced tissue oxygenation has been demonstrated to be reversible with intensified glycaemic control in type 2 diabetes, identification of these early changes could be valuable in the attempt to prevent long-term damage22. Preclinical models have been able to reverse neuropathy with an angiogenic growth factor13.
The integrity of the central parasympathetic regulation was investigated with carotid massage and deep breathing. Carotid massage activates baroreceptors within the carotid sinus, which relay a ‘false’ signal to the nucleus tractus solitarius (NTS) in the brainstem via the glossopharyngeal nerve (Cranial nerve IX). This stimulation triggers enhanced parasympathetic output, leading to a reduction in blood pressure. The study observed comparable responses in both controls and individuals with T1D, indicating intact baroreflex function and central parasympathetic regulation across both groups. To our knowledge, this is the first formal investigation of carotid massage response in this context, and no previous comparative studies are available.
Physiologically, deep breathing exaggerates respiratory sinus arrhythmia through vagal modulation of heart rate. Lung inflation activates pulmonary stretch receptors that inhibit vagal outflow via brainstem nuclei, increasing heart rate during inspiration, whereas vagal tone increases during expiration, resulting in a cyclical heart rate pattern. Notably, we observed a similarly pronounced increase in CVT in both groups, indicating preserved central parasympathetic function, likely attributable to the participants’ relatively young age and diabetes duration. When examining the effect on peripheral microcirculation, there were no differences in overall gaseous influx and efflux, suggesting that circulation in terms of peripheral gaseous exchange remained intact. However, the T1D group continued to exhibit the microvascular abnormalities observed at baseline during deep breathing, specifically a lower maximum tcpO₂ and higher minimum tcpCO₂ which is likely to be a metabolic effect. The failure to normalize these gaseous levels during parasympathetic stimulation suggests a reduced compensatory capacity in individuals with T1D.
The integrity of the sympathetic nervous system was assessed by evaluating the participants' ability to maintain orthostasis and tolerate physical exhaustion with a 3-minute sympathetic excitation during the handgrip test. Upon standing, blood pressure initially drops and is normally corrected by sympathetic vasoconstrictor activation. Orthostatic hypotension, common in diabetes, reflects sympathetic failure4, 23. In this study, the individuals with T1D responded similarly to the controls, indicating preserved sympathetic tone, underpinning the young cohort. However, the individuals with T1D exhibited consistently lower tcpO₂ both before and at the end of the handgrip test, alongside higher tcpCO₂, compared to controls. These findings suggest that although oxygen delivery improved, the underlying reduction in tissue oxygenation in T1D persisted. This demonstrates a reduced capacity to normalize tissue oxygenation under stress. But it can also be due to a change in metabolic substrates to those with low respiratory quotient, for example fats and proteins.
The Valsalva’s manoeuvre has five distinct phases of blood pressure changes with characteristic changes in the hemodynamics. This study found abnormal hemodynamics in T1D compared to the controls, despite comparable Valsalva RR-ratio responses. Notably, some of the controls had atypical hemodynamic responses, which are not uncommon and reflect normal physiological variability. The manoeuvre begins with increased intrathoracic pressure from forced exhalation, resulting in a transient rise in blood pressure (phase I), and the observed reduced systolic rise in blood pressure suggests that arterial elasticity is impaired, leading to diminished Windkessel function and thus less effective transmission of intrathoracic pressure. Arterial stiffness is a common feature of diabetes24, 25. The increase in intrathoracic pressure in this phase then reduces venous return to the heart leading to a drop in blood pressure during early phase II. The blunted drop in systolic blood pressure in T1D likely reflects impaired blood redistribution to the peripheral circulation due to higher baseline vascular resistance, although a contribution from reduced stroke volume cannot be ruled out, it is considered less likely given the young age of the participants26. As a result, less blood is sequestered outside the thoracic compartment during the strain, maintaining venous return and blunting the typical blood pressure fall. In normal physiology, this blood pressure drop is counteracted in late phase II by venous volume baroreflex activation and increased sympathetic tone to stabilise blood pressure. However, we observed elevated systolic and diastolic response in late phase II in the individuals with T1D. This pattern suggests exaggerated splanchnic auto-transfusion27. The alpha-1 adrenoreceptors mediate vasoconstriction in both the splanchnic and peripheral vasculature, increasing venous return and systemic vascular resistance, which together contribute to the heightened blood pressure during this phase. The hyperadrenergic state is a known phenomenon in postural tachycardia syndrome and long-COVID28, 29.
Diastolic blood pressure is related to changes in systemic vascular resistance mainly in the Windkessel vessels and its response during early phase II depends not only on intrathoracic pressure-induced reductions in preload, but also on the ability of blood to redistribute to the peripheral circulation to reduce the cardiac afterload. In our study, the diastolic blood pressure drop in early phase II was inversely correlated with baseline tcpO₂ indicating that low tissue oxygenation is associated with a blunted diastolic response. As tcpO2 reflects the balance between tissue perfusion and oxygen consumption, lower tcpO₂ may indicate both increased metabolic demand and higher vascular tone. The blunted response may reflect a combined effect of increased vascular tone and reduced Windkessel vessel conductance, limiting peripheral blood pooling and thereby maintaining the central venous return. While our findings in the individuals with T1D reveal clear phase-specific abnormalities, a previous study in type 2 diabetes reported no such hemodynamic changes30. However, that study involved a considerably older cohort, in whom age-related changes in cardiovascular and autonomic function would be expected.
We used the traditional RR-based ratios to categorize individuals into normal and abnormal CAN status, and noticeably, nearly all, regardless of diabetes status, greatly outperformed the age-adjusted reference values. These reference values are designed to detect overt dysfunction, and as such, offer limited sensitivity for identifying early or subclinical changes. Rather than relying solely on dichotomized CAN classification, examining individual-level changes in RR-based ratios may complement a more nuanced insight into the autonomic regulation that can reveal subtle reductions in autonomic adaptability that are not captured by binary thresholds. However, such individualized assessments are not yet suitable for routine clinical application.
Moreover, when comparing the mean E:I ratio to the max E:I ratio, the mean is 14% lower. This suggests that habituation occurs during the one-minute breathing cycle. Notably, previous studies have varied in their approach: some report the mean E:I ratio, others calculate the ratio using the mean of the three longest and three shortest RR-intervals, and some use the single maximum RR-interval divided by the minimum to capture peak vagal modulation31, 32, 33, 34. The degree of habituation differs between individuals. Therefore, given an average habituation of 14% and age-based staging thresholds that vary by only 2.7-4% per decade18, relying solely on the mean E:I ratio may underestimate autonomic function in individuals who exhibit strong habituation, potentially misclassifying several individuals. Thus, it is questionable to diagnose CAN based exclusively on the mean ratio, as the individual may simply habituate well to the test. Habituation may decrease with age, but since individual capacity cannot be predicted, it may be simpler, easier to translate between settings and more accurate to use the maximum E:I ratio when assessing parasympathetic function.
A major advantage of this study is the use of more comprehensive and advanced methodology than standard clinical assessments, combining high-frequency ECG (5000 Hz) with beat-to-beat blood pressure monitoring with transcutaneous gas profiling. This multimodal approach captured subtle physiological changes that would be missed by traditional test equipment. Unlike traditional assessments of endothelial function, such as flow-mediated dilation or peripheral arterial tonometry, which primarily reflect large-vessel physiology, transcutaneous measurements capture capillary-level function and the tissue consequences of early microvascular changes dysfunction. There is a wide range of reported tcpO₂ values in the literature, and our measurements fall within the lower end of this range for both controls and individuals with T1D35, 36. This may reflect methodological differences or potential device-related variation; therefore, we refrain from interpreting these findings as evidence of tissue hypoxia. Moreover, a relatively high prevalence of mild retinopathy in the cohort may limit generalizability and introduces a potential bias toward early-stage microvascular involvement. The relatively high mean HbA1c of this cohort with T1D may be related to the widespread use of continuous glucose monitoring systems and insulin pumps, allowing for more flexible glycaemic management rather than strict dietary restriction. Although circulating catecholamine measurements were not included in the present study, future studies incorporating plasma catecholamines could confirm the proposed hyperadrenergic response during the Valsalva manoeuvre. The controls were not selected based on normal autonomic testing, and some variation within the controls is to be expected. The limited sample size of this study affects generalisability, and thus, findings should be validated in larger cohorts. Longitudinal studies are also needed to investigate whether reduced tissue oxygenation follows the progression of autonomic dysfunction in T1D.
Conclusion
In conclusion, with the methodological limitations mentioned above, we show that individuals with T1D without autonomic or peripheral neuropathy exhibited reduced tissue oxygenation despite normal systemic oxygen saturation, which may suggest altered tissue oxygen metabolism or delivery. Although conventional autonomic function tests showed preserved functions, altered hemodynamic responses during phase I and II of the Valsalva’s manoeuvre may reflect possible changes in the arterial stiffness, vascular resistance and sympatho-vagal balance in the splanchnic region, consistent with a hyperadrenergic state.
Author contributions
MBP: project administration, conceptualization, investigation, formal analysis, visualization, writing – original draft. PJ: methodology, conceptualization, software, writing – review & editing. MeS: investigation, writing – review & editing. MuS: conceptualization, validation, writing – review & editing. CB: conceptualization, resources, writing – review & editing.
References
- 1.Braffett B H, Gubitosi-Klug R A, Albers J W. (2020) Risk Factors for Diabetic Peripheral Neuropathy and Cardiovascular Autonomic Neuropathy in the Diabetes Control and Complications Trial/Epidemiology of Diabetes Interventions and Complications (DCCT/EDIC) Study. Diabetes 69(5), 1000-1010.
- 2.Kempler P, Tesfaye S, Chaturvedi N. (2002) Autonomic neuropathy is associated with increased cardiovascular risk factors: the EURODIAB IDDM Complications Study. Diabet Med 900-909.
- 3.Morsby S K, Bitsch Poulsen M, Mark E B. (2025) The Symptom Burden of Autonomic Neuropathy Is Associated with Decreased Quality of Life in 6961 People with Diabetes. Diabetology 6-11.
- 4.Rasmussen V F, Thrysøe M, Nyengaard J R. (2023) Neuropathy in adolescents with type 1 diabetes: Confirmatory diagnostic tests, bedside tests, and risk factors. Diabetes Res Clin Pract 201-10.
- 5.Jaiswal M, Divers J, Urbina E M. (2018) Cardiovascular autonomic neuropathy in adolescents and young adults with type 1 and type 2 diabetes: The SEARCH for Diabetes in Youth Cohort Study. Pediatr Diabetes 19(4), 680-689.
- 7.Andersen S T, Witte D R, Fleischer J. (2018) Risk factors for the presence and progression of cardiovascular autonomic neuropathy in type 2 diabetes: Addition-Denmark. Diabetes Care 41(12), 2586-2594.
- 8.Gæde P, Oellgaard J, Carstensen B. (2016) Years of life gained by multifactorial intervention in patients with type 2 diabetes mellitus and microalbuminuria: 21 years follow-up on the Steno-2 randomised trial. Diabetologia 59(11), 2298-2307.
- 9.Ewing D J, Campbell I W, Clarke B F. (1980) Assessment of cardiovascular effects in diabetic autonomic neuropathy and prognostic implications. Ann Intern Med. 92(2 Pt 2, 308-311.
- 10.Julu P O, Hondo R G. (1992) Effects of atropine on autonomic indices based on electrocardiographic R-R intervals in healthy volunteers. J Neurol Neurosurg Psychiatry. 55(1), 31-35.
- 11.Rasmussen T K, Hansen J, Low P A. (2017) Autonomic function testing: Compliance and consequences. Auton Neurosci 208-150.
- 12.Lespagnol E, Dauchet L, Pawlak-Chaouch M. (2020) Early endothelial dysfunction in type 1 diabetes is accompanied by an impairment of vascular smooth muscle function: A meta-analysis. Front Endocrinol (Lausanne). 11, 525054-10.
- 13.Schratzberger P, Walter D H, Rittig K. (2001) Reversal of experimental diabetic neuropathy by VEGF gene transfer. J Clin Invest 107(9), 1083-1092.
- 14. . (2021).Postural Tachycardia Syndrome Gall N, Kavi L, Lobo MD, eds , Springer International Publishing; 10-1007.
- 15.Brinth L, Pors K, Mehlsn J, Sletten D M, Terkelsen A J et al. (2021) Translation and linguistic validation. of the Composite Autonomic Symptom Score COMPASS 31 in Danish. Dan Med 69-3.
- 16.Sletten D M, Suarez G A, Low P A, Mandrekar J, Singer W. (2012) COMPASS 31: A refined and abbreviated composite autonomic symptom score. Mayo Clin Proc 87(12), 1196-1201.
- 17.POO Julu, Hansen S, Jamal G A. (1996) Is baroreflex responsiveness (BRR) a function of height during isometric muscle contraction in human volunteers. Journal of Physiology. 491.
- 18.Spallone V, Ziegler D, Freeman R. (2011) Cardiovascular autonomic neuropathy in diabetes: clinical impact, assessment, diagnosis, and management. Diabetes Metab Res Rev 27(7), 639-653.
- 19.Nowicki M, Kosacka J, Serke H, Blüher M, Spanel‐Borowski K. (2012) Altered sciatic nerve fiber morphology and endoneural microvessels in mouse models relevant for obesity, peripheral diabetic polyneuropathy, and the metabolic syndrome. J Neurosci Res 90(1), 122-131.
- 20.Breuer H W, Breuer J, Berger M. (1988) Transcutaneous oxygen pressure measurements in type I diabetic patients for early detection of functional diabetic microangiopathy. EurJ Clin Invest. 18(5), 454-459.
- 21.Cé G V, Rohde L E, Silva AMV Da, MKP Coutinho, De Castro AC et al. (2011) Endothelial Dysfunction Is Related to Poor Glycemic Control. in Adolescents with Type 1 Diabetes under 5 Years of Disease: Evidence of Metabolic Memory. J Clin Endocrinol Metab 96(5), 1493-1499.
- 22.Iino K, Yoshinari M, Doi Y, Shinohara N, Iwase M et al. (1997) Reduced tissue oxygenation and its reversibility by glycemic control in diabetic patients. Diabetes Res Clin Pract 34(3), 163-8.
- 23.Zhou Y, Ke S J, Qiu X P, Liu L Bin. (2017) Prevalence, risk factors, and prognosis of orthostatic hypotension in diabetic patients: A systematic review and meta-analysis. Medicine. 96-36.
- 24.Kimoto E, Shoji T, Shinohara K. (2003) Preferential Stiffening of Central Over Peripheral Arteries in Type 2 Diabetes. Diabetes 52(2), 448-452.
- 25.Love K M, Horton W B, Patrie J T, Jahn L A, Hartline L M et al. (2022) Predictors of arterial stiffness in adolescents and adults with type 1 diabetes: a cross-sectional study. BMJ Open Diabetes Res Care. 10-1.
- 26.Romney J S, Lewanczuk R Z. (2001) Vascular Compliance Is Reduced in the Early Stages of Type 1 Diabetes. Diabetes Care 24(12), 2102-2106.
- 27.Sandroni P, Benarroch E E, Low P A. (1991) Pharmacological dissection of components of the Valsalva maneuver in adrenergic failure. J Appl Physiol 71(4), 1563-1567.
- 28.Ocher R A, Padilla E, Hsu J C, Taub P R. (2021) Clinical and Laboratory Improvement in Hyperadrenergic Postural Orthostatic Tachycardia Syndrome (POTS) after COVID-19 Infection. Case Rep Cardiol 1-3.
- 29.Okamoto L E, Urechie V, Rigo S. (2024) Hyperadrenergic Postural Tachycardia Syndrome: Clinical Biomarkers and Response to Guanfacine. Hypertension 81(11), 2237-2247.
- 30.Rasmussen T K, Finnerup N B, Singer W, Jensen T S, Hansen J et al. (2022) Preferential impairment of parasympathetic autonomic function in type 2 diabetes. Auton Neurosci 243-10.
- 31.Hansen C S, MMB Christensen, Vistisen D. (2024) Normative data on measures of cardiovascular autonomic neuropathy and the effect of pretest conditions in a large Danish non-diabetic CVD-free population from the Lolland-Falster Health Study. Clinical Autonomic Research 35(1), 101-10.
- 32.Spallone V, Bellavere F, Scionti L. (2011) Recommendations for the use of cardiovascular tests in diagnosing diabetic autonomic neuropathy. Nutrition, Metabolism and Cardiovascular Diseases 21(1), 69-78.
- 33.LRM Tannus, Sperandei S, Montenegro Júnior RM. (2013) Reproducibility of methods used for the assessment of autonomous nervous system’s function. Auton Neurosci 177(2), 275-279.
- 34.Mathias C J, Corazza I, Guaraldi P, Barletta G, Cortelli P. (2017) Autonomic Nervous System: Clinical Testing. In: Reference Module in Neuroscience and Biobehavioral Psychology. Elsevier; 911-928.