
Abstract
In this work we present how it is possible to visualize the different coronavirus outbreaks from the calculation of the mantissa from the daily record of cases by Covid-19.This curve can also indicate the speed of propagation of the disease from the calculated infection rate. These conclusions are derived from the respective calculations in four different countries: Australia, Brazil, Italy, and Venezuela.
Author Contributions
Copyright © 2022 Raúl Isea
 This is an open-access article distributed under the terms of the Creative Commons Attribution License, which permits unrestricted use, distribution, and reproduction in any medium, provided the original author and source are credited.
Competing interests
The authors have declared that no competing interests exist.
Citation:
Introduction
Isea proposed a new graphical representation to be able to visualize the different epidemic outbreaks from the calculation of the mantissa obtained from the daily Covid-19 cases 1, 2, 3. This calculation made it possible to explain the different outbreaks that occurred in Venezuela from March 15 to September 9, 2020 3.
We propose that the calculation of the mantissa may be associated with the propagation spread of infections by Covid-19, similar to infection rate. Let us remember that traditionally the infection rate is usually a constant value that quantifies the infection rate of disease 4.
For this reason, we are going to obtain a mathematical expression that will determine the time-dependent infection rate according to the SIR compartmental model, and evaluate it numerically to show the association with the mantissa obtained from the registry of daily cases.
This calculation is very simple to do, and it can even be done from a cell phone, with the limitation that is valid only if the total number of people is representative in the country (details in the work methodology). Finally, we evaluated four different countries, ie., Australia, Brazil, Italy, and Venezuela, corresponding to different moments of the Covid-19 pandemic
Methodology
This paper presents the possibility of being able to associate the epidemic outbreaks Covid-19 with the infection rate obtained from the calculation of the mantissa according to the systematic registration of cases by Covid-19. To do that, we will first calculate the mantissa of infected cases, and later on, an expression of the type of the infection rate according to the SIR compartmental model.
Mantissa Calculation
This methodology has been used in several scientific publications 1, 2, 3, it means, from the daily record of cases by Covid-19 obtained from Johns Hopkins University (coronavirus.jhu.edu), we calculated the mantissa, abbreviated as M(t) according to the following equation:

Where Ii(t) is the cumulative confirmed Covid-19 cases by world region in a time t, log10(Ii(t) is the logarithm evaluated to the base ten, while that (Ii(t) represents the integer part of the numerical result.
Let us remember that the values of the mantissa range from zero to one, where a value of zero corresponds to the absence of an epidemic outbreak, while a value of one corresponds to a high rate of spread of Covid-19 infections in this country.
Calculation of the Infection Rate
We are going to determine a mathematical expression capable of quantifying the infection rate, traditionally abbreviated as β, based on the time-dependence SIR compartimental model. To do this, we remember the differential equations initially proposed by Kermack and McKendrick in 1927 5, whose analytical solution was recently explained in recent years see for example 6

where the constants β, γ, N represent the infection rate, recovery rate, and the total number of people, respectively. This model considers the total population is susceptible to contracting this disease S(t), and only a fraction can be infected, I(t) according to infection rate defined by β. Finally, the population recovers, R(t), at a recovered rate given by γ; with the condition that
We are going to study the dynamics of contagion in entire countries. By considering the following approximation S(t)≈N and substituting it into equation (3), we can obtain an expression for γ(t), given by:

So the expression to get the infection rate β(t) will be simply:

As can be seen in the previous equation (5), the calculation of the infection rate only depends on the cases infected and recovered over time.
Results
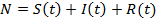
The daily record of cases by Covid-19 was obtained from the database managed by Johns Hopkins University, and we will only consider four countries: Australia, Brazil, Italy, and Venezuela. From these values, we calculated the value of the mantissa according to equation (1) and later the infection rate according to equation (5). The results can be seen in figure 1, Figure 2, Figure 3, and Figure 4 corresponding to Australia, Brazil, Italy, and Venezuela, respectively. In these figures, the calculation of the mantissa is represented in green, while the infection rate is in blue.
Figure 1.Calculation of the values of the mantissa (green color) and the infection rate (blue) of the cases registered by Covid-19 in Australia.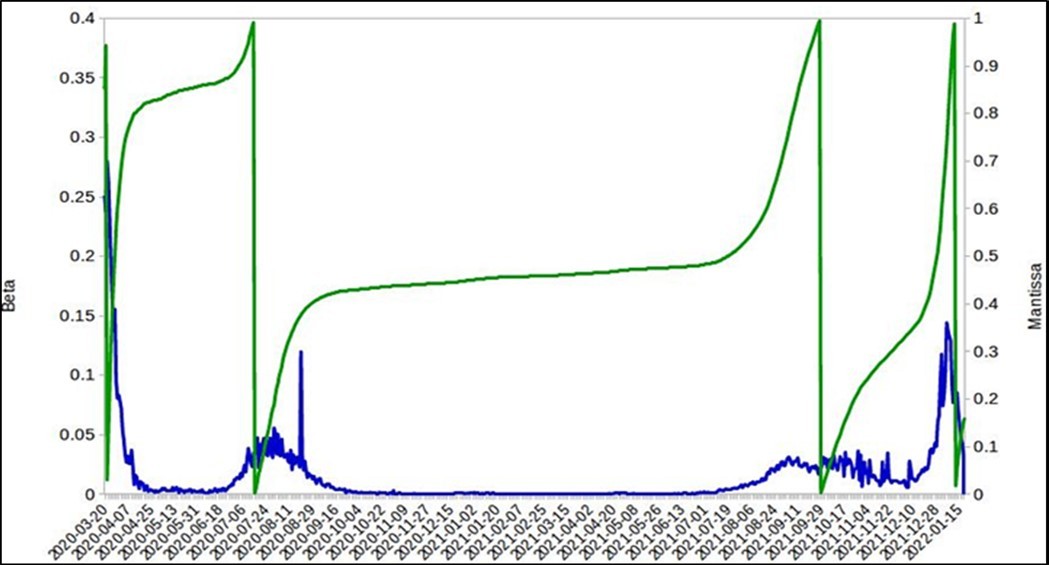
Figure 2.Calculation of the values of the mantissa (green color) and the infection rate (blue) of the cases registered by Covid-19 in Brazil.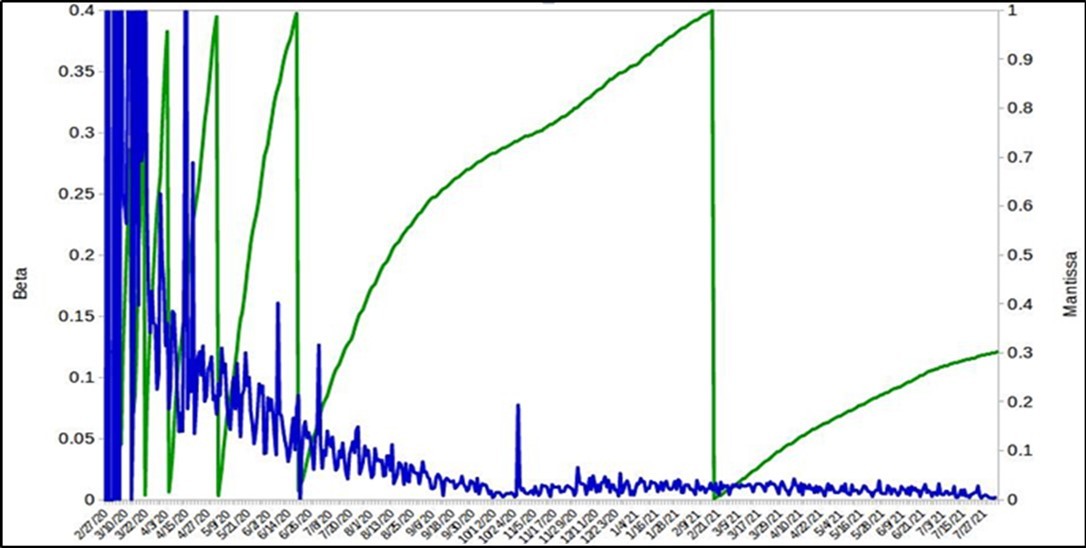
Figure 3.Calculation of the values of the mantissa (green color) and the infection rate (blue) of the cases registered by Covid-19 in Italy.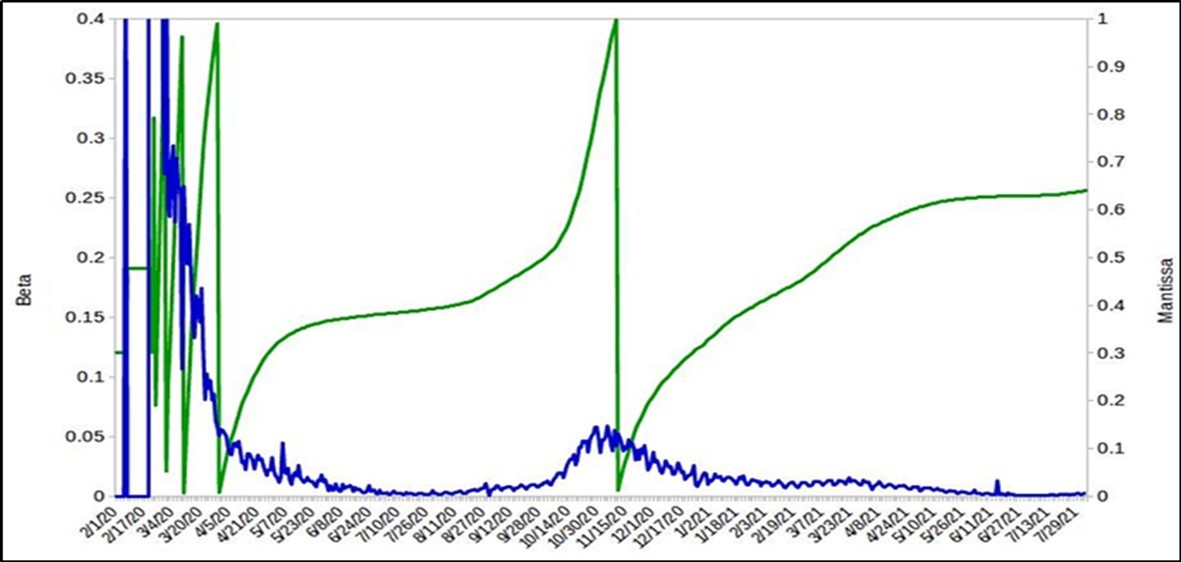
Figure 4.Calculation of the values of the mantissa (green color) and the infection rate (blue) of the cases registered by Covid-19 in Venezuela.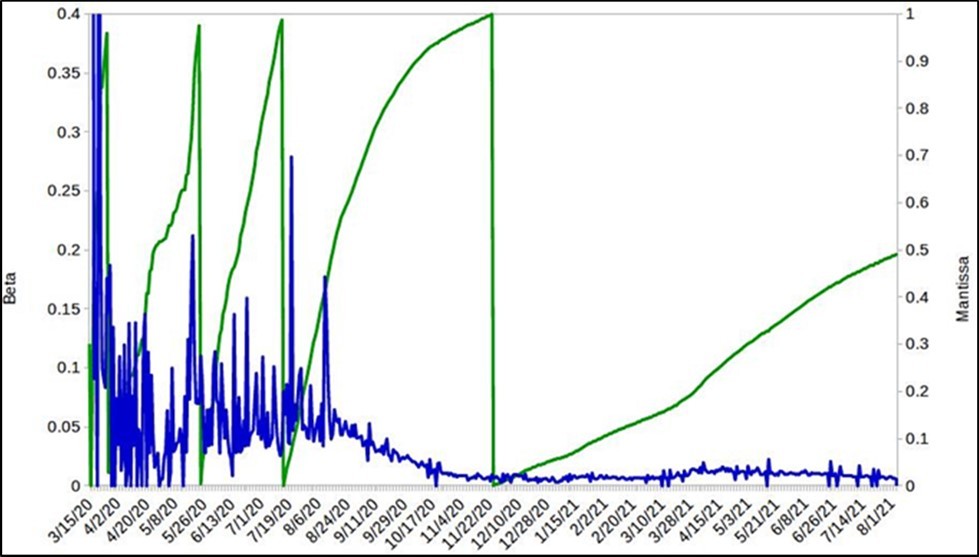
Figure 1 shows the result obtained in Australia (one of the first countries where the pandemic spread), and we can observe an outbreak in March 2020, followed by other in July of the same year. These moments are precisely two periods where the Covid-19 affected that country. Finally, another infectious focus began to be registered towards the end of the year associated (mainly) with the variant called Omicron.
Figure 1 also shows three complete cycles in the calculation of the mantissa, that is, three different beginnings where the values varies from zero to one. We call them a Mantissa propagation cycle. The first began from March to August, the second from August to October, and finally the last until January 2022. It is interesting to mention that the calculation of the mantissa coincides at those moments to high values of the infection rate obtained with equation (5). Hence, we can associate the mantissa of cases with epidemic outbreaks without being able to differentiate which variant it corresponds to.
The results obtained in the case of Brazil are shown in Figure 2. Unlike Australia, in the first months in Brazil there were multiple outbreaks (green color). These variations are also observed in the calculation of the infection rate (in blue) until October 2020, when the country begins to overcome this pandemic. Later, in January 2021, it can be seen how the infection rate fluctuates around a constant value until the end of February 2021.This value probably represents a dominant variant in this country.In addition, you can see how fast the virus spread in Brazil in the first half of 2020 (blue curve).
The results in the case of Italy are shown in Figure 3. We observed an increase in the mantissa curve in March 2020, which corresponds to a significant increase in cases in the country, and this country had to impose a series of lockdowns to stop these epidemic outbreaks. Moreover, the authorities prohibited any physical activity in the country until March 22, 2021, and this period was later extended until May 3. From May 4, a series of measures began that relaxed the confinement measures until October and it is surprising that this behavior is also observed in the mantissa graph (Figure 3). Towards the end of November of last year, Italy detected the Omicron variant and it is again reflected in the mantissa graph.On the other hand, we can see the speed of spread in Covid-19 cases in the first quarter of 2020 (blue curve).
Finally, the results obtained in Venezuela can be seen in figure 4. We can see that the mantissa of the Covid cases is completely different from the rest of the countries, probably due to the lockdown scheme called "7+7", it means, seven days out of quarantine where there was no type of activity allowed in the country, and later on, seven days where only social distancing and the use of face masks were imposed. Thanks to this, by the end of November 2020 there were no longer significant outbreaks, and there was only an increase due to the presence of other strains of the virus. The speed of spread of the virus in Venezuela is lower than the rest of the countries previously studied.
Conclusion
This paper presents a graphic representation that can help to visualize the different outbreaks by Covid-19 from the calculation of the mantissa. Also, an idea of the speed of spread of this disease in these countries can be derived. This assumption is in accordance with a mathematical expression that presents the infection rate dependent-time according to the SIR model. In fact, this type of calculation has the advantage of being able to visually identify the control measures carried out by a government as well as being able to generate alerts in the case of increases that can generate new outbreaks.
Dedicatory
This work is dedicated to all the people who work in medical services who continually expose their lives to help recover all those people who are being infected by this pandemic.
Acknowledgment
I’d like to acknowledgment to Rafael Mayo-Garcia by your help and patience in read and comments this manuscript.
References
- 1.Isea Raúl.A New Graph to Display the Epidemic Outbreaks of Covid-19 in the World. , International Journal of Coronaviruses 1(4), 1-3.
- 2.Isea Raul, Karl E Lonngren. (2020) A quick Look at the Registered Cases of Covid-19 Throughout the World. , International Journal of Coronaviruses 1(3), 16-21.
- 3.Isea Raúl. (2020) Characterizing the Transmission Dynamics of the Cases Registered by. Covid-19 in Venezuela According to Epidemic Wave and the Value of the Mantissa. International Journal of Coronaviruses 2(2), 8-12.
- 4.Isea Raul. (2020) La dinámica de transmisión del covid-19 desde una perspectiva matemática. Revista el Observador del Conocimiento. 5(1), 15-19.
Cited by (1)
- 1.Isea Raúl, Mayo-García Rafael, 2022, Analysis of Covid-19 Using A Modified SEIR Model To Understand The Cases Registered in Singapore, Spain, And Venezuela, Journal of Model Based Research, 1(4), 13, 10.14302/issn.2643-2811.jmbr-22-4258