
Characterization of Ground Water Quality in Southern and Northern Region of Zanzibar Island
Abstract
Millions of people from different countries depend on groundwater, which might contain elevated levels of unhygienic constituents. Poor quality of drinking water in many countries has been forcing people to use bottled water. In the present study, groundwater samples were collected in November 2014 leading to twenty-nine analysis of groundwater samples. The primary objective of this paper is to study the selected groundwater quality parameters as an establishment of preliminary baselines on groundwater constituents. A total of twenty nine water samples were collected (fourteen and fifteen samples from North and South regions of Zanzibar Island respectively. Physical parameters (Turbidity, oxidation-reduction potential ORP, Eh, pH, total dissolved soild TDS, salinity, and Electrical conductivity (EC) were determined in situ using Horiba multiparameters digital meters. Analysis of anions (NO3-, Br- , SO42-, F-, NO2-) was carried out using Ion chromatography (IC). Nitrite and nitrate for some water were below detection limit (BDL) The order of relative abundance for anions in samples collected at Northern region of Zanzibar Island, was NO3- > Br- > SO42- > F- > NO2- , while for the Southern region the order was NO3- >Br- > NO2- > SO42- > F- . In both regions, the orders for other parameters were; Turbidity > pH > salinity; and EC >TDS > ORP > Eh. Almost all the measured parameters were within the WHO guidelines for drinking water. However, for nitrate and bromide, the percentage that exceeded the WHO limit was 7%, and 10.3% respectively. Based on toxicological perspective, although few samples had concentrations above groundwater quality criterion it is fundamental to estimate the intake by humans through the drinking water pathways.
Author Contributions
Copyright © 2021 Abdul AJM, et al.
 This is an open-access article distributed under the terms of the Creative Commons Attribution License, which permits unrestricted use, distribution, and reproduction in any medium, provided the original author and source are credited.
Competing interests
The authors have declared that no competing interests exist.
Citation:
Introduction
Water is the most essential liquid for maintaining life on the earth and its sustenance. According to Miller (1997) about 97% water exists in oceans that is not potable, and only 3% is fresh water (2.97% is comprised by glaciers and ice caps, and 0.3% is available as a surface and ground water). Safe drinking water is a fundamental need for good health; it is also a basic human right. In many parts of the world, fresh water is already an inadequate resource.
In the next century, it is anticipitated to be even more limiting due to factors such as increased population, urbanization and other environmental degradations. Nevertheless, there is a general belief that groundwater is purer and safer than the surface water due to the protective qualities of the soil cover. On the other hand, groundwater can be considered as a renewable resource depending on its usage and consumption.
Furthermore, there is a general knowledge gap regarding which chemicals are present in various products related to motorized transports, detergents, building constructions materials including paints cements etc, solid and liquid wastes such as obsolete electronic devices, and how big is their amounts. Thus, current knowledge about the spread of these chemicals in to the environment is also insufficient. This creates a kind of motivation for in-depth investigation about toxicants entering different ecosystems.
Announced that the groundwater is never chemically pure, as at any given time, it is invariably exposed to some of the minerals, which in turn results into minerals dissolution. 1
Generally, groundwater quality refers to its chemical, physical, biological, and isotopic characteristics. Usually, the quality of groundwater is controlled by several factors including rock types, climate, and human activities 2. As the groundwater is polluted anthropogenically, groundwater pollution becomes a serious global problem. Thus the analysis of the water quality is very important to preserve and protect the natural eco system.
The biological and physico-chemical composition of groundwater varies depending upon several factors for instances; contact time of recharge water with the surrounding soil or rock material, frequency of precipitation (which will leach out different materials) and duration of rainwater in the soil before reaching the respective aquifers. Nevertheless, anthropogenic release of pollutants to the ground is a potential source of groundwater contamination. This is because; pollutants released on to the ground, most probably find their way down to the soil profiles into the groundwater aquifers.
Groundwater contamination is very common in water sources located within unplanned settlements characterized with dense population and poor or no sanitation facilities. Consequently, as recharge water moves down the soil profile, it picks up a wide range of chemical species, such as magnesium, calcium, and chlorides. This process deteriorates the quality of the recharged water 3.
Groundwater quality determines its suitability for different purposes such as, domestic, drinking, agricultural, and even industrial purposes. Thereby, the knowledge on the groundwater quality as well as its quantity is very important. 4
Accordingly, this study aimed at characterizing ground water quality in Southern and Northern region of Zanzibar Island based selected physico-chemical parameters (Turbidity, Eh, ORP, pH, EC, TDS, sulphate, bromide, nitrate, nitrite, and fluoride) so as to find out the perception applicability of a general belief that groundwater (due to the protective qualities of the soil cover) is always pure and safer source of water.5
Material and Method
Twenty-nine community water sources (dug wells and bore wells) were investigated during an initial field survey and laboratory analysis, some wells were specifically chosen to find some association of the measured parameters with the location of wells. The groundwater samples were collected in November 2014 leading to twenty-nine sets of groundwater sampling and analysis. The groundwater samples were collected based on standard procedures in 500 mL capacity bottles. The positions of the wells were marked using Global Positioning System (GPS) as depicted in figure 1. Before the sampling, all bottles were soaked with diluted nitric acid solution, washed with distilled water, and again prior to each sampling, each bottle was washed with the water to be sampled. In the case of bore wells, the water samples were collected after pumping the water for sufficient time to collect the formation water. The collected samples were then transported and stored in laboratory for analysis. Handling of the samples at different stages was in accordance with the protocol given in the standard EPA method 200.7.
Figure 1.Sampling station in North and South regions of Zanzibar Island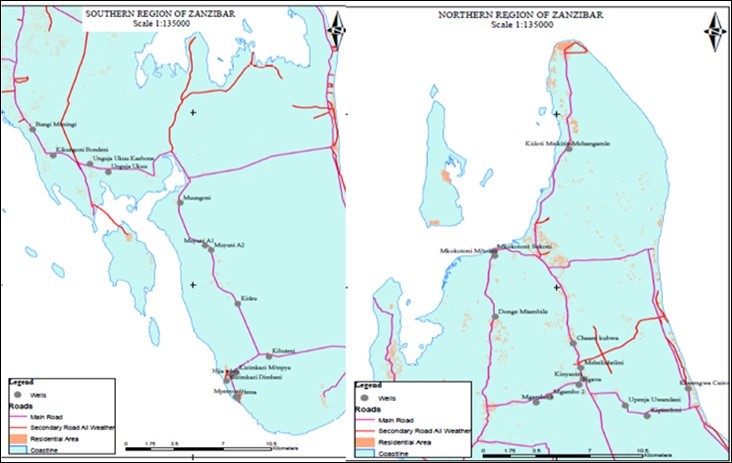
Prior to anions analysis, all samples were filtered using 0.45 µm Millipore filter paper. Concentrations of bromide, sulfate, nitrate, nitrite, and fluoride, in the groundwater samples were analyzed using an Ion Chromatograph (IC Metrohm 883 with column type Metrosep A Supp 5 - 150/4.0) along with appropriate standards. Calibration chromatogram for the seven analyzed parameters (figure 2), and chromatogram for nitrite and fluoride (figure 3 and figure 4) all are well presented in this paper.
Figure 2.Calibration chromatogram for seven analyzed anions
Figure 3.Calibration curves for Nitrite
Figure 4.Calibration curves for Fluoride
Result and discussion
The general summary for the descriptive statistics of the twenty-nine analyzed water samples is depicted on table 1.
Table 1. Descriptive Statistics| Parameters | N | Minimum | Maximum | Mean | Std. Deviation | Variance | WHO |
| Turbidity (NTU) | 29 | 0.0 | 19.0 | 3.53 | 4.63 | 21.48 | 5 |
| Eh (mV) | 29 | -79 | 16 | -23.48 | 21.35 | 455.83 | NA |
| pH | 29 | 7 | 8 | 7.24 | 0.36 | 0.129 | 6.5-8.5 |
| ORP(mV) | 29 | 93 | 319 | 250.31 | 52.11 | 2.715E3 | NA |
| EC (µS/cm) | 29 | 190 | 7150 | 900.31 | 1392.12 | 1.938E6 | 1000 |
| TDS (mg/L) | 29 | 123 | 4510 | 567.52 | 867.37 | 7.523E5 | 1000 |
| Sulfate (mg/L) | 29 | 0.00 | 5.205 | 0.442 | 1.23 | 1.52 | 250 |
| Bromide (mg/L) | 29 | 0.026 | 7.002 | 0.644 | 1.63 | 2.66 | NA |
| Nitrate (mg/L) | 29 | 0.0 | 144.174 | 18.66 | 30.16 | 909.92 | 50 |
| Fluoride (mg/L) | 29 | 0.0 | 0.544 | 0.18 | 0.11 | 0.013 | 1.5 |
| Nitrite (mg/L) | 29 | 0 | 3 | 0.16 | 0.615 | 0.38 | 3 |
| Salinity (ppt) | 29 | 0.1 | 2. | 0.33 | 0.36 | 0.13 | NA |
Sulfate
The level of sulfate in the analyzed water samples within Northern region of Zanzibar Island ranged from BDL to 5.0205 mg/L, while in the Southern region of Zanzibar the range was from BDL to 1.709 mg/L. The average sulfate value was 0.442 mg/L. All water samples had the concentrations of sulfate, which were within an acceptable WHO limit (Figure 5).
Figure 5.Levels of Sulfate in Northern and Southern region of Zanzibar Island
Fluoride
The level of fluoride in analyzed water samples within Northern region of Zanzibar Island ranged from BDL to 0.544 mg/L, while in the Southern region of Zanzibar the range was from BDL to 0.433 mg/L, with an average of 0.442 mg/L. All water samples had the concentration of fluoride within an acceptable WHO limit (Figure 6).
Figure 6.Levels of Fluoride in Northern and Southern region of Zanzibar Island
Bromide
The level of bromide in the analyzed water samples within Northern and Southern region of Zanzibar Island ranged from 0.026 mg/L to 7.002 mg/L, and 0.086 mg/L to 5.883 mg/L respectively, with an average of 0.644 mg/L (Figure 7). Based on the acceptable daily intake of bromide (6 mg/L) as given by World Health Organization, some groundwater sources (Sites 4 and 20 of Northern and Southern region respectively) could be considered unsafe for human consumption. Nevertheless, based on the toxicity data from literature, and the groundwater quality criterion of 1 mg/L, only 10.3% (N=29) of the groundwater samples were above the limit. The sources of bromide in the region could be a result of natural as well as anthropogenic sources.
Figure 7.Levels of Bromide in Northern and Southern region of Zanzibar Island
Salinity and EC
There was a remarkable correlation (r = 0.49) between salinity and EC (Table 2). Very strong correlation was observed between salinity and EC.
Table 2. Correlation matrix for the analyzed parameters in Northern and Southern region of Zanzibar Island| Sulphate | Bromide | Nitrate | Fluoride | Nitrite | Salinity | EC | |
| Sulphate (mg/L) | 1 | -0.05 | 0.393 | 0.022 | 0.131 | -0.097 | 0.018 |
| Bromide (mg/L) | -0.05 | 1 | 0.047 | 0.225 | 0.601 | -0.084 | 0.956 |
| Nitrate (mg/L) | 0.393 | 0.047 | 1 | -0.272 | 0.15 | -0.051 | 0.112 |
| Fluoride (mg/L) | 0.022 | 0.225 | -0.272 | 1 | 0.122 | -0.153 | 0.277 |
| Nitrite (mg/L) | -0.097 | -0.084 | -0.051 | -0.153 | -0.17 | 1 | -0.124 |
| Salinity(ppt) | 0.131 | 0.601 | 0.15 | 0.122 | 1 | -0.17 | 0.49 |
| EC | 0.018 | 0.956 | 0.112 | 0.277 | 0.49 | -0.124 | 1 |
Nitrate
For samples collected from Northern and Southern regions of Zanzibar Island, the minimum and maximum nitrate levels (in mg/L) are given in Figure 8. In overall, the concentration of nitrate in groundwater from these regions varied from below detection limit (BDL) to 144.174 mg/L. Average value of nitrate was 18.66 mg/L. Health and Welfare World Guidelines had established a limit of 45 mg NO3-/ L (WHO-2004). Thus, the percentage of groundwater samples exceeding this limit is about 7% (N=29). It noteworthy to point out that the exceeded levels of nitrate both came from water samples (site 10 and 11) of North region of Zanzibar Island.
Figure 8.Levels of Nitrate in Northern and Southern region of Zanzibar Island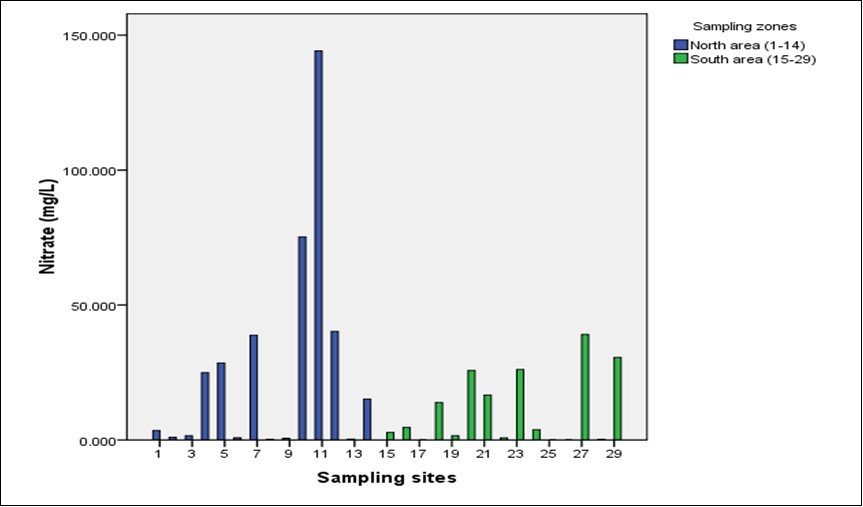
Nitrite
The level of nitrite in the analyzed water samples within Northern region was below detection limit of the instrument. Nitrite concentration in Southern region of Zanzibar Island ranged between BDL to 2.981mg/L. Mean nitrite level was 0.16 mg/L. In all water samples, the concentrations of nitrite were in an accepted WHO guideline (Figure 9).
Figure 9.Levels of Nitrite in Northern and Southern region of Zanzibar Island
Electrical Conductivity (EC) and TDS
Within Northern region, the levels of electrical conductivity (EC) in water samples was in the range of 260 to 1250 µS/cm, while in Southern region of Zanzibar, electrical conductivity ranged between 224 to 3980 µS/cm. Mean levels of electrical conductivity was 900.32 µS/cm (Figure 10). About 14% and 20% of analyzed water samples from North and South regions respectively had EC levels above WHO (1000 µS/cm) guideline. For TDS, highest levels of TDS were from respective site number 4 and 20 of Northern and Southern region of Zanzibar (Figure 10 & Figure 11).
Figure 10.Levels of EC in Northern and Southern region of Zanzibar Island
Figure 11.Levels of TDS in Northern and Southern region of Zanzibar Island
pH, Eh, and ORP
pH in Northern region, the levels of pH in water samples ranged between 6.58 to 7.36, while in Southern region of Zanzibar, pH ranged between 6.85 to 8.17(Figure 12). All analyzed water samples (from both regions) were within WHO recommended range of 6.5 to 8.5. Remarkably, water samples from Northern region of Zanzibar were more acidic (low pH values) compared to those from Southern region. Contrarily, water samples from Northern region of Zanzibar have higher electrical potential when compared to samples from Southern region (Figure 13). Meanwhile, both lowest and highest level of ORP in analyzed water was witnessed in 8 and 10 of North region of Zanzibar Island The higher the value of ORP indicates the water is in more oxidative condition (Figure 14). Systems with the highest ORP values are believed to be in contact with the atmosphere and are likely to contain shallow or even young ground water.
Figure 12.Levels of pH in Northern and Southern region of Zanzibar Island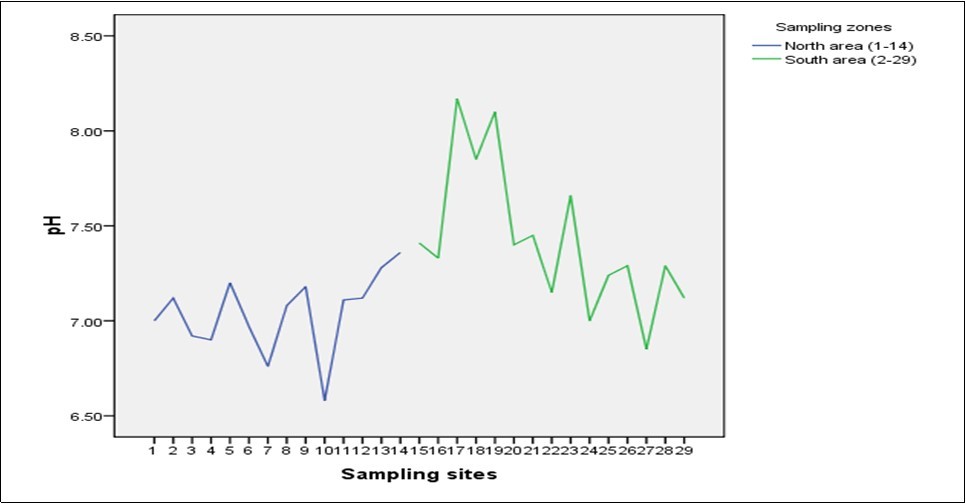
Figure 13.Levels of Eh in Northern and Southern region of Zanzibar Island
Figure 14.Levels of ORP in Northern and Southern region of Zanzibar Island
Eh & pH Correlation
There was a negative correlation between Eh and pH of analyzed water samples (Figure 15)
Figure 15.Eh and pH correlation in Northern and Southern region of Zanzibar Island
Conclusion
Generally, almost all the measured parameters were within the WHO guidelines for drinking water. However, for nitrate (7%) and bromide (10.3%) exceeded the WHO limit respectively. The finding suggests for the establishment of guidelines, which outline better management framework for safe drinking water that comprises important key good health preventive components.
Acknowledgments
The authors of this manuscript would like to express thanks to His Majesty Government of Brunei Darussalam for funding this project, the State University of Zanzibar for permission for study leave. Special thanks to the staff of the faculty of Science of University Brunei Darussalam for their assistance. To mention few are, Hjh Faridah, Azzlin, Hjh Rasiah, Hj Jamil, Najib, and other UBD chemistry laboratory staffs for providing the necessary facilities and technical support they offer for the successful completion of the project.
References
- 1.Etu-Efeotor J O. (1998) Hydrochemical Analysis Surface and Groundwater of Gwagwalada Area of Central Nigeria. , Global Journal of Pure and Applied Sciences 4(2), 153-162.
- 2.Elhag A B. (2016) New Diagram Useful for Classification of Groundwater Quality. , British Journal of Earth Sciences Research 4(4), 49-54.
- 3.AJ M Abdul, Ibrahim A, Lee H L, Khamis S A.Mbwana KH(2016) An Index Approach to Metallic Pollution in Groundwater Sources of South Region of Pemba Island. , Science Journal of Analytical Chemistry 4(2), 12-21.