
Docosahexaenoic Acid Supplementation is Not Anti- Inflammatory in Adipose Tissue of Healthy Obese Postmenopausal Women
Abstract
Adipose tissue inflammation is associated with obesity comorbidities. Reducing such inflammation may ameliorate these comorbidities. n-3 fatty acids have been reported to have anti-inflammatory properties in obesity, which may modulate this inflammatory state.
In the current study a 1 gram per day oral supplement of the n-3 fatty acid docosahexaenoic acid (DHA) was administered for 12 weeks to 10 grade 1, 2 obese postmenopausal women and markers of adipose tissue and systemic inflammation measured and compared before and after supplementation.
DHA administration resulted in approximately a doubling of plasma and red cell phospholipid and adipose tissue DHA content but no change in systemic markers of inflammation, such as circulating C-reactive protein (CRP) or interleukins (IL) 6, 8 and 10 (IL-6, IL-8, IL-10). DHA supplementation did not alter the adipose tissue marker of inflammation crown-like structure density nor did it affect any gene expression pathways, including anti-inflammatory, hypoxic and lipid metabolism pathways.
The obese postmenopausal women studied were otherwise healthy, which leads us to suggest that in such women DHA supplementation is not an effective means for reducing adipose tissue or systemic inflammation. Further testing is warranted to determine if n-3 fatty acids may ameliorate inflammation in other, perhaps less healthy, populations of obese individuals.
Author Contributions
Academic Editor: Jie Yin, Institute of Subtropical Agriculture & University of Chinese Academy of Sciences, China
Checked for plagiarism: Yes
Review by: Single-blind
Copyright © 2017 Peter R. Holt, et al
 This is an open-access article distributed under the terms of the Creative Commons Attribution License, which permits unrestricted use, distribution, and reproduction in any medium, provided the original author and source are credited.
Competing interests
The authors have declared that no competing interests exist.
Citation:
Introduction
Obesity is increasing throughout the world and the associated chronically inflamed adipose tissue is thought to contribute to co-morbidities, such as cardiovascular and liver diseases, diabetes, and cancers, including post-menopausal breast cancer 1, 2. The n-3 long chain polyunsaturated fatty acids, docosahexaenoic acid (DHA) and eicosapentanoic acid (EPA), are essential nutrients that are minimally synthesized in humans but are derived mainly from marine or vegetable sources 3. Fish oils containing DHA and EPA have been used clinically to lower plasma triglycerides and blood pressure as well as the risk of cardiovascular disease 4 and insulin resistance 5, 6. In addition, products containing these n-3 fatty acids appear to improve symptoms in a number of clinical inflammatory conditions such as rheumatoid arthritis and asthma 7. An important potential outcome of supplemental n-3 fatty acids would be a reduction in obesity-associated inflammation in white adipose tissue (WAT). A hallmark of adipose inflammation is macrophage infiltration around dead and dying hypertrophied adipocytes, a pathologic lesion that is defined as a crown-like structure (CLS, 8). These CLS are associated with increased pro-inflammatory gene expression) accompanied by greater cytokine and chemokine secretion by adipocytes, making CLS a useful biomarker to test the anti-inflammatory effects in WAT of n-3 fatty acid supplementation 9.
The Western style diet is rich in saturated fatty acids and in omega-6 (n-6) polyunsaturated fatty acids and is relatively low in n-3 fatty acids. In obese subjects, the components of this diet might promote unhealthy adipose tissue inflammation 10. High levels of saturated fatty acids can activate innate immune cell toll-like receptor 4 (TLR4) to promote tissue inflammation and insulin resistance 11. n-6 fatty acids can promote the synthesis of lipid mediators including prostaglandins, thromboxanes and leukotrienes which can also promote inflammation and are deleterious to glucose homeostasis 12. Systemic inflammation often is accompanied by an increase in the urinary excretion of prostaglandins and leukotrienes 13. In contrast, the n-3 fatty acids, EPA and DHA have been described as possessing anti-inflammatory properties that might oppose the pro-inflammatory effects of obesity 14.
There are human 15 and rodent 16 studies suggesting that n-3 fatty acids can inhibit tissue inflammation by altering the production of inflammatory mediators by competing with n-6 fatty acids such as arachidonic acid for enzymes in the pro-inflammatory eicosanoid biosynthetic pathway 17. In addition, n-3 fatty acids can be converted into resolvins which have potential anti-inflammatory properties 18 and can signal through GPR 120 on monocytes to dampen M1 gene expression and promote M2 anti-inflammatory gene expression 19. These and other potential mechanisms for the anti-inflammatory effects of n-3 fatty acids have been extensively reviewed 20. It must be emphasized that rodent studies showing reduced adipose inflammation have used very large doses of n-3 fatty acids 21 and that human studies have been performed with a wide variety of n-3 fatty acid containing products 22. The absence of human intervention studies with n-3 fatty acids has been criticized 23.
The data on existing intervention studies with n-3 fatty acids to modify WAT inflammation in humans is controversial. If adipose tissue inflammation is a determinant of obesity complications then we would expect that potent anti-inflammatory agents would reduce such inflammation.
Data from 3 studies in insulin resistant patients or obese individuals undergoing bariatric surgery describe anti-inflammatory actions of 3-n fatty acids in adipose tissues 24, 25, 26. In contrast, one study found no effect of 3-n fatty acids on subcutaneous adipose tissues in subjects with normal glucose tolerance 27.
The positive data on n-3 fatty acids has stimulated widespread consumption of n-3 fatty acids as dietary supplements to reduce inflammatory conditions and improve health. Our hypothesis for the present study was that DHA would reduce inflammation and CLS density in subcutaneous adipose tissues resulting in lower circulating CRP, circulating cytokines and urinary eicosanoid excretion, reflecting decreased systemic inflammation and oxidative stress. Our results refute this hypothesis.
Materials and Methods
Subjects
Eligible subjects were class 1-2 obese (BMI 30 - 40) postmenopausal women (defined as >2 years without a menstrual period). Subjects were recruited from the community through advertising, as well as participation in a Rockefeller University Hospital registry of subjects previously screened for research studies. Excluded were subjects with abnormal liver function tests, bleeding disorders, platelet count <120 x 103 and prothrombin time > 12 seconds, fasting blood glucose > 130 mg/dl and blood pressure > 140/90mm Hg. In addition, subjects with clinical cardiovascular disease, clinical type 2 diabetes receiving oral hypoglycemic agents, smokers, regular users of aspirin, non-steroidal anti-inflammatory drugs, fish oils or vitamin D supplements, or with a history of gastrointestinal surgery other than appendectomy, or any cancers other than non- melanoma skin cancers were ineligible. Twenty-three subjects were screened and 13 subjects were enrolled. Of the 13 enrolled subjects, 10 subjects completed the 12 week study, 1 developed hematuria before beginning the n-3 fatty acid product, 1 was intolerant of the product, and 1 refused the end of study fat biopsy. Of those who completed the study, 4 were Caucasian and 6 were African American. Mean age of the study subjects was 61.1 +/- 5.3 years. This was a single center study performed at The Rockefeller University Hospital between July 2010 and February 2012. Subjects underwent a medical examination, laboratory tests and an electrocardiogram in order to exclude obesity complications. A Transparent Reporting of Evaluation with Nonrandomized Designs (TREND) flow chart summarizing subject selection is shown in Figure 1.
Trial Approval and Registration
The study was approved by the Institutional Review Boards at Rockefeller University, Weill Cornell Medical College, and Memorial Sloan Kettering Cancer Center, and registered under ClinicalTrials.gov identifier NCT 01127867.
Interventions
Upon acceptance into the study the subjects were interviewed by our research nutritionists and administered a standard questionnaire to quantitate the macronutrient composition of their normal diet 28. Subjects were then admitted to the Rockefeller University Hospital for 3-4 days and while being kept on an approximation of their normal diet underwent baseline studies as described below.
Specimen Collection and Analysis
Fasting blood samples were analyzed in the Clinical Pathology Laboratory of the Memorial Sloan Kettering Cancer Center for electrolytes, liver function, renal function and high sensitivity CRP. Aliquots of serum for cytokine measurements, including IL-6, IL-8, IL-10 and TNF-α were stored at -80O C for subsequent analysis.by ELISA in the New York City Obesity Research Center. Body composition was measured using the BodPod Tracking system based on air displacement plethysmography (COSMED, Italy). Resting energy expenditure calorimetry determination was performed using a Vmax indirect calorimeter metabolic cart (Viasys Health Care, Yorba Linda Ca.).
Analysis of urinary eicosanoid excretion was performed on an early morning spot urine collection by liquid chromatography – mass spectrometry in the Vanderbilt University Eicosanoid Core Laboratory as described 29. All urine eicosanoid levels were normalized to creatinine (mg/mL).
Subcutaneous adipose tissue aspiration biopsies were performed under local anesthesia between 0800-1100h, after an overnight fast. The initial adipose tissue biopsy was taken in the left lower quadrant of the abdomen while the final biopsy was taken in the right lower quadrant. The quadrants were alternated to avoid the potential of the results being confounded by trauma related to the initial biopsy. Adipose tissue was formalin-fixed and paraffin embedded for immunohistochemistry and frozen in RNA later for subsequent RNA extraction and analysis.
In addition, body composition was determined by BodPod and resting energy expenditure by indirect calorimetry.
Prior to discharge from the hospital, the study coordinator instructed study volunteers to take the DHA capsules twice daily (total 2000 mg containing about 1 gram of DHA) with food. The capsules consisted of 43% DHA, small amounts of myristic, oleic and palmitic acids. Subjects were provided a diary for measurement of weight and nutritional supplement intake.
They were taught to weigh themselves at the same time twice weekly and every effort was made to maintain their baseline weight and usual diet intake choices. Subjects were contacted every 1-2 weeks by telephone and were seen by the research coordinator and research nutritionist at about 6 weeks after initiation of DHA administration at which time a pill count also was performed. Fasting blood was obtained for hematological and biochemical analyses and plasma and red cell phospholipid fatty acid analysis. Subjects were readmitted to the hospital after a total of 12 weeks +/- 4 days and had a repeat of baseline testing.
CLS Quantification in Adipose Tissue Biopsies
Abdominal WAT biopsies were obtained at the initial hospitalization and upon readmission 12 weeks later. CLS in abdominal WAT biopsies were quantified as described 30. At the time of each biopsy, samples were fixed in formalin for 24 hours and then embedded in one paraffin block. Six sections were cut at 50μm intervals. The first section was stained with hematoxylin and eosin to insure the sample was representative of normal adipose tissue. Subsequent sections were stained immunohistochemically for the macrophage marker CD68 (mouse monoclonal KP1 antibody; Dako; dilution 1:4,000) to identify CLS by light microscopy. The number of CLS per section was recorded by the study pathologist (DG). The area of adipose tissue examined per section was measured using Image J software (NIH, Bethesda) which was done for all 5 sections per block. Data for CLS density were expressed as mean +/- standard deviation of CLS/cm2.
Fatty Acid Composition
Subcutaneous adipose tissue fatty acid composition was analyzed as described by Yurko-Mauro et al 31. In brief, adipose tissue total lipids were extracted using the method of Folch et al 32. Tricosanoic free fatty acid (NuCheck Prep, Elysian, MN,(USA) was added to each sample as an internal standard. Butylated hydroxytoluene was added before saponification and all samples were purged with nitrogen throughout the process to minimize oxidation. Total lipids were saponified and the fatty acids were converted to methyl esters 33. Fatty acid methyl esters were analyzed by gas liquid chromatography with a flame ionization detector. Peaks were identified by comparison of retention times with external fatty acid methyl ester standard mixtures fromNuCheck Prep. The fatty acid profiles of the adipose tissue total lipids were expressed as a weight percent. Fatty acid composition of red cells and plasma was determined using previously established methods 34.
Gene Expression Analysis
Total RNA was extracted from approximately 0.5g of snap frozen adipose tissue using a Qiagen RNeasy Lipid Tissue Mini Kit (Germantown, MD) as previously described 35. RNA quality was assessed using an Agilent Bioanalyzer at the Rockefeller University Genome Core Laboratory. Two to three μg of RNA with RNA Integrity Number >7 were submitted for 50 bp single end read RNA sequencing of polyA-enriched RNA, also at the Genome Core Laboratory.
We studied RNA-Seq samples from 20 tissues of 10 patients before DHA treatment and after DHA treatment. All 20 samples (10 before and 10 after) were sequenced at the Rockefeller University Genomic Core at least 40 million reads/sample. All samples were then examined using FASTQC 36. The reads were aligned to the human genome (version hg19) using STAR 9 37 aligner with default parameters. The alignment results were evaluated through RNA-SeQC 38 to ensure that all the samples had a consistent alignment rate, and no obvious 5’ or 3’ bias. Align reads were then summarized through feature Counts 39 with the gene model from Ensemble at gene level.
To eliminate the between-sample differences in read counts, the summarized counts matrix was then normalized through DESeq2 40. DESeq2 was again applied to the normalized counts to estimate the fold change between two conditions and generate the regularized-logarithmic transformed matrix for pathway analysis using Gene Set Enrichment Analysis (GSEA, Broad Institute, Cambridge MA), Ingenuity Pathway Analysis (IPA, Qiagen) and Gene Set Variation Analysis algorithm. An adjusted p-value of less than 0.05 (padj<0.05) was used to select genes that have a significant expression change. Unadjusted p-values were used for plotting.
Quantitative RT-PCR Analysis
Confirmation of gene targets of interest by qRT-PCR was performed using the Taqman FastVirus OneStep RT-PCR kit (Applied Biosystems) with inventoried probes for the noted genes and normalized to expression of Beta-2-microglobulin. The inventoried probes used are as follows: SCD1 Hs01682761_m1; LDLR Hs01092524_m1; VLDLR Hs01045922_m1; LRP1 Hs00233856_m1; CETP Hs00163942_m1; PLA2G6 Hs00185926_m1; PLA2G7 Hs00965837_m1; DGAT2 Hs01045913_m1; LPL Hs00158701_m1; APOE Hs00171168_m1; LEP Hs00174877_m1; NLRP3 Hs00918082_m1; AdipoR1 Hs01114951_m1; AdipoR2 Hs00226105_m1;CDH13 Hs01004530_m1.
Statistical Analyses
Demographic and clinical characteristics of the participants were summarized using mean with standard deviation and median with 25th and 75th percentiles. Two-tailed paired t-tests and Wilcoxon signed-rank tests were used to compare anthropometric measurements, biochemical variables, serum cytokines and immunohistochemical results before and after DHA administration. The false discovery rate was used to adjust for multiple testing. The 5% significance level was set as decision threshold. GraphPad Prism, R and Excel were used for data visualization. SAS Studio version 3.5 and RStudio version 3.2 were used for statistical analyses. After regularized-logarithmic transformation, the GSVA algorithm was used to map the matrix of transformed counts to a matrix of pathway activities for a set of 1454 curated pathways (gene sets) available in the Molecular Signatures Database (MsigDB). Linear mixed-effects models were applied to estimate and to compare the pathways activities before and after DHA administration. Clustering genes within pathways and inspecting pre- and post -differences with supervised heat maps provided elements for visual comparisons. Heat maps were column-wise scaled based on Euclidean distance and complete linkage algorithm for hierarchical clustering.
Power analysis was performed to test significance of changes in RNA-Seq gene expressions from baseline to post-treatment with the application of two-sided paired t-test. Based on preliminary data from the present study, we have estimated an average coefficient of variation (biological variability) of 90%. Assuming an average depth of coverage per gene of 20, a minimum sample size of 150 subjects would be needed to detect effect sizes larger than 1.5 fold-changes with 80% power at 5% experiment wise significance. Calculations were performed with the function RNA power in RNASeqPower library available in R software.
Results:
As shown in Figure 1, of the 23 subjects assessed for eligibility, 13 were enrolled in the study. Of these 1 did not receive DHA due to the discovery of hematuria, 1 discontinued DHA due to mild gastrointestinal intolerance and another refused the final WAT biopsy (Figure 1). Ten completed the protocol and their data were analyzed.
Figure 1.Trend diagram for the study. Twenty-three subjects were screened, 13 were randomized, 1 was excluded prior to allocation and intervention, 1 subject discontinued due to intolerance and 1 refused the final adipose tissue biopsy.
The mean composition of the pre-study diets of the subjects who completed the study is shown in TABLE 1 and the diet generally was maintained throughout the study period managed by frequent interactions with the research nutritionists. The nutrient intake of our study subjects comprised about 34 percent fat and 50 percent carbohydrate and generally reflects the Western style diet usually consumed by the United States population. Compliance for taking the study supplements was excellent based on pill counts at the 6 week interval visit and study end at 12 weeks (data not shown). Furthermore compliance was confirmed by the greater than 1-fold increase in plasma and red blood cell phospholipid DHA levels as a percentage of total fatty acids at the end of the study (TABLE 2). Much of the increase was already detectable at the 6 week time point (data not shown). Fat stores represented 50.8 +/- 6.0 percent of total body composition and resting energy expenditure was within 5.0 % of normal.
TABLE 1. PRE-STUDY DIET COMPOSITION| Calories (kcal) | Mean (SD) 2312 (709) | Median (Q1, Q3) 1967 (1897, 2496) |
| Protein (g) | 101 (14) | 101 (90, 105) |
| % Protein | 18.3 (3.2) | 18.7 (16.9, 20.5) |
| CHO (g) | 288 (116) | 249 (208, 316) |
| % CHO | 48.7 (6.0) | 48.9 (45.2, 54.7) |
| Fat (g) | 87 (26) | 74 (970, 94) |
| % Fat | 34.1 (4.0) | 33.4 (31.2, 36.6) |
| Saturated fat (g) | 32 (9) | 31 (25, 37) |
| Monounsaturated fat (g) | 27 (10) | 23 (20, 33) |
| Omega 6/Omega 3 ratio | 11.6 (10.8)* | 8.9 (7.2, 9.7) |
| Omega 6 (g) | 11.5 (6.1) | 9.7 (7.8, 12.7) |
| Omega 3 (g) | 1.2 (0.6) | 1.1 (0.8, 1.2) |
| Cholesterol (mg) | 360 (75) | 356 (300, 415) |
| Total Dietary fiber (g) | 22.7 (6.8) | 21.6 (19.2, 24.9) |
| Soluble fiber (g) | 4.7 (2.3) | 5.1 (2.4, 6.2) |
| Insoluble fiber (g) | 6.9 (3.4) | 7.7 (4.5, 9.2) |
The substantial increase of plasma and red cell phospholipid DHA as a percentage of total fatty acids was accompanied by an increase in EPA and decreases in several n-6 fatty acids including arachidonic acid (TABLE 2A). Both plasma and red cell phospholipids showed a highly significant decrease in the ratio of n-6 to n-3 fatty acids (p<0.002). In adipose tissue, the DHA content as a percent of total fatty acid content increased significantly from a mean of 0.13 to 0.27 percent (p<0.002) without a significant change in any other fatty acid species, but with an overall decrease in the ratio of n-6 to n-3 fatty acids (p<0.04) (Table 2B).
TABLE 2A. PLASMA AND RED CELL PHOSPHOLIPID AND ADIPOSE TISSUE FATTY ACID COMPOSITION| Fatty Acid | Pre | Post | P-value | Pre | Post | P-value | |
| Linoleic acid | C18:2 | 21.27 (3.82) | 21.38 (1.4) | 0.77 | 14.87 (2.5) | 14.59 (2.73) | 0.56 |
| C18:3n-3 | |||||||
| Alpha linoleic acid | 0.22 (0.09) | 0.25 (0.05) | 0.32 | 0.21 (0.1) | 0.21 (0.07) | 0.37 | |
| Dihomo-gamma-linoleic acid | |||||||
| C20:3n-6 | 3.34 (1.52) | 2.6 (0.91) | 0.004* | 1.66 (0.8) | 1.55 (0.4) | 0.004* | |
| Arachidonic acid | C20:4 | 14.1 (5.63) | 11.13 (3.1) | 0.004* | 15.51 (2.98) | 13.15 (1.98) | 0.002* |
| Eicosapentaenoic acid | C20:5n-3 | 0.57 (0.37) | 1.13 (0.21) | 0.002* | 0.55 (0.23) | 0.9 (0.23) | 0.002* |
| Adrenic acid | C22:4n-6 | 0.48 (0.16) | 0.24 (0.06) | 0.002* | 3.73 (0.23) | 2.46 (0.29) | 0.002* |
| Docosapentaenoic acid | C22:5n-3 | 0.8 (0.06) | 0.4 (0.11) | 0.002* | 2.06 (0.47) | 1.15 (0.26) | 0.002* |
| Docosahexaenoic acid | C22:6n-3 | 2.96 (0.84) | 8.48 (2.13) | 0.002* | 4.11 (1.24) | 9.3 (1.46) | 0.002* |
| Omega6 | 41.08 (0.88) | 35.62 (2.25) | 0.002* | 36.62 (1.19) | 33.15 (3.7) | 0.004* | |
| Omega3 | 4.71 (0.99) | 10.0 (1.6) | 0.002* | 6.76 (2.17) | 11.46 (1.22) | 0.002* | |
| Omega6/Omega3 ratio | 8.67 (1.83) | 3.54 (0.6) | 0.002* | 5.4 (2.18) | 2.93 (0.54) | 0.002* |
| Adipose Tissue | ||||
| Fatty Acid | Pre | Post | P-value | |
| Linoleic acid | C18:2 | 19.28 (2.90) | 18.91 (3.14) | 0.56 |
| Alpha linoleic acid | C18:3 n-3 | 0.35 (0.66) | 0.67 (0.73) | 0.38 |
| Dihomo-gamma-linoleic acid | C20:3n-6 | 0.36 (0.07) | 0.34 (0.05) | 0.81 |
| Arachidonic acid | C20:4 | 0.45 (0.19) | 0.54 (0.14) | 0.51 |
| Eicosapentaenoic acid | C20:5n-3 | 0.05 (0.03) | 0.05 (0.04) | 0.39 |
| Adrenic acid | C22:4n-6 | 0.20 (0.06) | 0.22 (0.07) | 0.44 |
| Docosapentaenoic acid | C22:5n-3 | 0.18 (0.06) | 0.20 (0.06) | 0.47 |
| Docosahexaenoic acid | C22:6n-3 | 0.13 (0.10) | 0.27 (0.09) | 0.002* |
| Omega6 | 20.78 (3.31) | 20.37 (3.15) | 0.56 | |
| Omega3 | 0.84 (0.57) | 1.11 (0.68) | 0.05 | |
| Omega6/Omega3 ratio | 23.54 (30.19) | 17.77 (11.81) | 0.04 | |
The study subjects’ weight and BMI were stable and differed by less than 3 percent between the start and end of the 3 month study period (TABLE 3). Furthermore, the DHA regimen had no effect on either systolic or diastolic blood pressure. Surprisingly, DHA administration was associated with a significantly increased fasting serum glucose concentrations 6 percent (p<0.001) (TABLE 4). Aspartate aminotransferase and alanine transaminase levels also were higher although still within the normal range. At the same time, the prothrombin and partial thromboplastin times fell marginally without a change in serum estradiol or testosterone levels. Circulating hsCRP, interleukin 6, 8 and 10 and TNF-a were unaffected by DHA administration. Furthermore, the excretion of urinary eicosanoid metabolites, which can reflect systemic inflammation and oxidative stress, including prostaglandin E2 metabolite (PGE-M), prostaglandin D2 metabolite (PGD-M), prostacyclin metabolite (PGI-M), leukotriene E4 (LTE4), and F2-isoprostanes, were not significantly affected by the DHA administration (TABLE 5).
TABLE 3. EFFECTS OF DHA ADMINISTRATION ON BIOMETRICS DATA| Mean (SD) | |||
| Weight (Kg) | 95.6 (9.6) | 96.1 (10.3) | 0.34 |
| BMI (Kg/M²) | 36.0 (2.6) | 36.2 (2.9) | 0.26 |
| BP Systolic | 118 (8.2) | 119 (5.4) | 0.59 |
| BP Diastolic | 79 (6.7) | 78 (5.1) | 0.56 |
| Glucose (mmol/L) | 5.62 (0.7) | 5.95 (0.76) | 0.001* |
| AST (units/l) | 19.7 (3.5) | 22.1 (3.1) | 0.04 |
| ALT (units/l) | 16.8 (4.6) | 19.8 (6.8) | 0.05 |
| Prothrombin time (sec) | 11.0 (0.7) | 10.7 (0.7) | 0.02 |
| PTT (sec) | 30.5 (3.4) | 30.3 (3.2) | 0.03 |
| Estradiol (ng/L) | 14.3 (7.6) | 14.4 (7.0) | 0.89 |
| Testosterone (nmol/L) | 0.59 (0.30) | 0.55 (0.17) | 0.62 |
| Inflammatory Markers Hs CRP (mg/dl) | |||
| 0.5 (0.4) | 0.4 (0.3) | 0.37 | |
| IL-6 (pg/ml) | 1.7 (0.4) | 1.5 (0.7) | 0.66 |
| IL-8 (pg/ml) | 11.1 (3.6) | 9.4 (2.0) | 0.14 |
| TNF-a (pg/ml) | 14.8 (3.2) | 13.9 (1.6) | 0.48 |
| IL-10 (pg/ml) | 3.1 (2.0) | 2.9 (1.8) | 0.77 |
| Pre-DHA | Post-DHA | p Value | |
| umol per mg creatinine | |||
| F2-IsoPs | 1.42 (0.08) | 1.4 (0.7) | 0.91 |
| PGI-M | 0.8 (0.3) | 0.7 (0.2) | 0.18 |
| PGE- M | 5.2 (2.1) | 4.8 (2.1) | 0.43 |
| PGD- M | 1.0 (0.5) | 0.9 (0.4) | 0.44 |
| LTE4 | 0.02 (.03) | 0.08 (0.0) | 0.27 |
The primary end points of the study were the changes in adipose tissue biopsies obtained before and after the intervention. Adipocyte diameters did not change significantly (data not shown). Measurement of adipose tissue CLS density has been used as an index that correlated with potentially deleterious complications in obesity. Mean CLS density at the baseline was 0.40 (+/- 0.4), no different from study end 0.29 (+/- 0.4). Figure 2 shows the data on CLS density in individual subjects and demonstrates the marked variation between subjects.
Figure 2.Effect of DHA supplementation on subcutaneous adipose tissue Biopsies were obtained before and after DHA administration and subjected to CD68 immunohiastochemical analysis. Line plot of CLS density (CLS/cm2) between pre DHA and post DHA (p=0.43).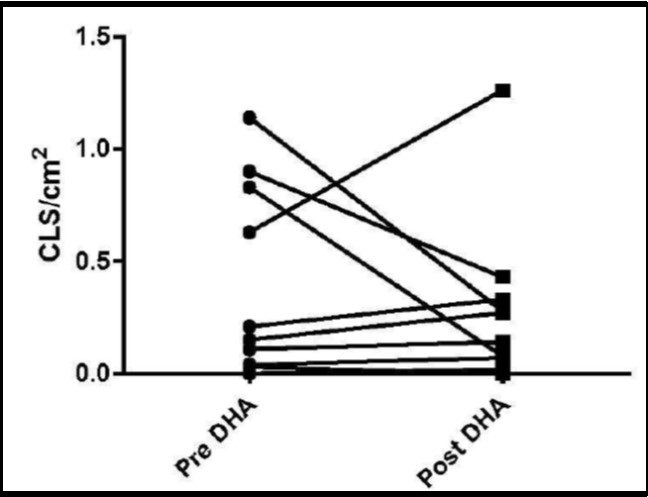
Transcriptomic analysis of adipose tissue biopsies was performed on all study subjects by RNA Seq. Prior to initiating the study, we hypothesized that DHA treatment for 3 months would reduce inflammatory (and hypoxia) signals in adipose tissue as well as potentially altering lipid synthesis and metabolism. Unsupervised analysis showed that no gene pathways were significantly upregulated or downregulated after correction for multiple testing. Supervised analysis showed inflammatory (Supplemental Figure 1) and lipid metabolism (Supplemental Figure 2) gene expression pathways were very variable between subjects and their responses to DHA.
We performed quantitative PCR analysis for selected genes of interest related to lipid metabolism and to check the validity of the gene expression data based on RNA Seq analysis. No significant changes were found in a priori selected lipid metabolism genes (data not shown). These negative results might have occurred because our study was underpowered with 10 subjects. We therefore determined on the basis of our RNA SeQ data how many subjects we would need in order to see a statistically positive effect of DHA. Only 17 genes in the extensive RNA SeQ data showed statistical cut off after correction for multiple testing. Based on statistical p value adjustment for a type 1 error, a future study to potential show an effect of DHA on adipose tissue inflammatory gene expression would need a sample size larger than 150 subjects to achieve 80% power to detect a moderate to large effect size.
Supplemental Figure 1.Supervised heat map showing differences in expression post and pre DHA administration for genes in inflammatory pathways (Molecular Signature Database).Subjects are shown on the x axis and individual genes on y axis.
Supplemental Figure 2.Supervised heat map showing difference in expression post and pre DHA administration for genes involved in lipid metabolism pathways (Molecular Signature Database). Subjects are shown on the x axis and individual genes on the y axis.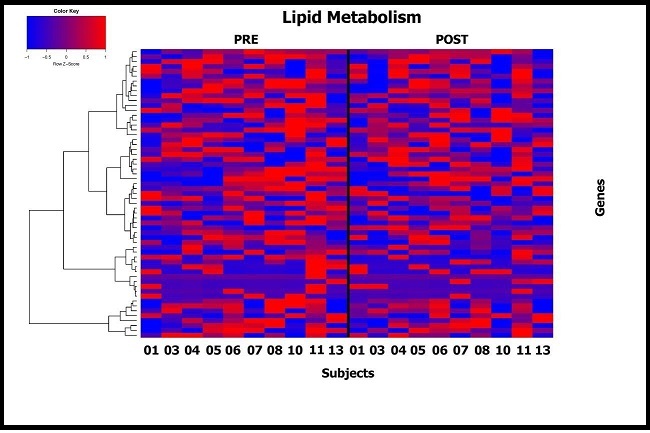
Discussion
The present study was designed to investigate mechanisms that might underlie the reported anti- inflammatory effects of n-3 fatty acids in obesity. For this purpose, we evaluated the effects on subcutaneous adipose tissue inflammation of DHA, one important n-3 fatty acid, provided as a supplement of 1 gram per day for 3 months to obese postmenopausal women. Post- menopausal women were selected to avoid the confounding effects of menstrual cycle timing, and because obesity and its complications including adipose tissue inflammation 41 are common after menopause. The agent was well tolerated. Indeed, 2 subjects reported some relief from arthritic symptoms. There were no changes in body weight nor were there changes in systemic inflammatory markers.
The administration of the DHA supplement clearly was effective in increasing plasma and red cell membrane phospholipid DHA by 93% and 125%, respectively, as a percentage of fatty acids. In addition, adipose tissue DHA content almost doubled. In spite of this pronounced incorporation of DHA, we could detect no significant change in adipose tissue and plasma markers of inflammation.
Early hypotheses suggested that fish oil supplementation might prevent insulin resistance in obese rodents 42. This hypothesis was confirmed subsequently in numerous studies using high fat diet induced obesity rodent models. Fickova fed obese rats diets rich in n-3 or n-6 fatty acids for only 1 week and claimed that circulating lipids and insulin levels fell accompanied by an increase in adipocyte fluidity with n-3 fatty acid feeding 43. Rats made obese with a cafeteria- type diet who were fed an EPA ester compound for 5 weeks showed reduced retroperitoneal adipose tissue mass and lower TNF alpha gene expression 44. Other mouse studies suggested that n-3 fatty acids would reduce adipose cellularity by limiting hyperplasia 45. Most recent preclinical studies have focused on the ant-inflammatory effects of n-3 fatty acids on adipose tissues of obese rodents 46. Anti-inflammatory changes from n-3 fatty acid feeding have been described in diabetic db mice 47. These preclinical studies have been extensively reviewed 48, 49. It must be emphasized that many of these studies used doses of n-3 fatty acids well in excess of what would be feasible to use on a per kilogram basis in human translational studies.
Studies of the effects of dietary supplemented n-3 fatty acids administration on adipose tissues in human subjects are limited. Three studies in insulin resistant subjects found improvements in inflammatory markers in subcutaneous adipose tissue biopsies taken after 2-3 months of n-3 fatty acid administration. Two months of treatment with fish oil in type 2 diabetic patients lowered adipocyte diameters and reduced the expression of some anti-inflammatory genes in WAT [15). Itariu later reported treatment of non-alcoholic severely obese subjects (BMI >40 kg/m2) with about 900 mg of EPA+DHA supplements for 8 weeks prior to planned bariatric surgery 26. A control group did not receive an n-3 fatty acid supplement. MCP-1 gene expression was downregulated in the surgically obtained adipose tissue compared to controls without other significant changes in pro-inflammatory markers and no differences in infiltrating macrophages. Spencer’s group described treatment of 19 metabolic syndrome patients who were not diabetic but showed glucose intolerance with a similar n-3 fatty acid mixture for 12 weeks and reported a small but significant reduction in WAT macrophage numbers and CLS density 25. Studies of adipose tissues in chronic kidney disease patients 50 and pregnant women 51 suggested some reduced inflammatory endpoints with n-3 fatty acid supplementation. However, no studies of non-diabetic obese subjects directly compared adipose tissues before and after the n-3 fatty acid supplementation in the same subjects. In the present study, CLS density varied considerably between subjects and was lower at baseline than the average CLS density shown in Spencer’s paper 25. Another study of 12 overweight to moderately obese subjects and 12 controls provided about 900 mg per day of an EPA compound for 12 weeks also did not find any effect in the expression of 12 genes encoding major mediators of inflammation in subcutaneous adipose tissue 27.
In our study, we investigated effects of the intervention on adipose tissue CLS density and on changes in gene expression indicative of a pro-inflammatory state, hypoxia and on lipid synthesis and metabolism. CLS can occur in adipose tissues throughout the body in obese subjects and CLS density has been used as a surrogate marker for the degree of adipose tissue inflammation 52. We found no effects of the intervention on adipocyte diameters or CLS density. CLS density was quite low in our subjects in the baseline biopsy and the changes after DHA were variable and non-significant. The potential mechanisms for n-3 fatty acids impact on adipose tissue metabolism are numerous and have been extensively reviewed 53, 54. However, we found no changes in gene expression of the inflammatory pathways that we evaluated nor in individual pro-inflammatory genes. Furthermore, there was no change in gene expression or pathways related to hypoxia, lipid synthesis or metabolism. We had the opportunity to explore the effects of DHA administration for 3 months on plasma and red cell membrane phospholipid composition (TABLE 2). The DHA content of red cell phospholipids increased approximately 1-fold accompanied by a decrease in the n-6: n-3 fatty acid ratio and a marked reduction in the concentrations of n-6 fatty acids.
Fish oils which contain EPA and DHA have been reported to reduce serum lipids, improve glucose tolerance, decrease insulin resistance and even lower the risk of breast cancer 1. Adipose tissue inflammation is an acknowledged risk factor for many complications of obesity. Therefore, means to prevent or to reduce inflammation in visceral and subcutaneous adipose tissues is an objective of prevention and therapy in obese subjects. However, in our study 12 weeks of DHA administration did not reduce the levels of any of the inflammatory markers measured. Not all obese individuals, even if morbidly obese, are at risk for these obesity-related complications, a condition defined as “healthy obesity”. Such individuals have evidence of less adipose inflammation than those with complications 55, 56.
What may explain the differences in these human studies? We enrolled postmenopausal women as a homogeneous group of test subjects. There are no data in the literature to our knowledge for any reduced effect of n-3 fatty acids based on gender or for age under 80 years of age 57. We used a dose of the DHA supplementation which is tolerable in long term studies 58 and which resulted in marked incorporation of DHA into plasma and red cell membrane making it unlikely that larger doses would be more effective. We used only DHA whereas others have used combinations of EPA with DHA. These two omega-3 fatty acids have been reported to have some differing metabolic 59 effects and EPA has been reported to be the more anti- inflammatory fatty acid 60. It is conceivable that intestinal microbiota, which differ between individuals, could biodegrade n-3 fatty acids 61 and alter their absorption. This is unlikely to have occurred in a major way in our study since red cell phospholipid DHA content increased so markedly
Our study subjects were very obese with a mean BMI of about 36 kg/m² but were healthy with no evidence of systemic inflammation, diabetes, liver disease or hypertension and by definition were “healthy obese”. Following DHA administration, they showed no reduction in circulating inflammatory markers or in urinary eicosanoid excretion.
The negative intervention study of Kratz et al 27 also recruited young, only moderately obese subjects (mean BMI 30Kg/m²) with normal baseline inflammatory markers. In contrast, the other studies described used obese subjects that already were insulin resistant and thus had “unhealthy obesity”.
The strength of our study was the use of DHA without EPA at doses shown to benefit circulating lipoprotein levels. Furthermore, we evaluated adipose tissue CLS density, a good marker of adipose inflammation and both unsupervised and supervised analysis of adipose tissue gene expression.
A weakness of our study is that we only enrolled postmenopausal women. However, obesity is particularly common in postmenopausal women who suffer disproportionally from obesity associated complications. We only included 10 subjects in our study. However, as described earlier, if we planned to repeat a study using our gene expression data in adipose tissue in an attempt to find an anti-inflammatory effect of DHA we would need to recruit over 150 subjects for adipose tissue biopsy which is impractical. We did not include a control group receiving no supplemental DHA because differences between subjects greatly exceed intra- individual results for CLS density and gene expression data. Thus, we compared results before and after DHA intervention in each individual subject.
Conclusion
On the basis of this and other studies 62, we conclude that n-3 fatty acid supplements have little effect on adipose tissue inflammation in healthy obese individuals who have no evidence of inflammatory complications of the disease. Several studies have suggested that EPA+DHA esters may reduce adipose inflammation and thus be potentially useful in ameliorating cardiovascular and liver complications in metabolically unhealthy individuals.
Further short and long term studies of these fatty acids in metabolically unhealthy obese patients are warranted to determine if this group of obese individuals will benefit from n-3 fatty acid supplementation.
Funding:
Supported by the National Center for Advancing Translational Sciences (NCATS) grant # UL1TR000043, NIH Clinical and Translational Science Award (CTSA) program to Rockefeller University, the Rockefeller University Center for Basic and Translational Research on Disorders of the Digestive System from the Leona M. and Harry B. Helmsley Charitable Trust, The Rockefeller University Sackler Center for Biomedicine and Nutrition from La Fondation Sackler and the MSKCC Kovachi Breast Cancer Prevention Fund.
Author’s Contributions
PRH Designed the study and was responsible for the final contribution.
JOA Analyzed data.
JMW Conducted the research hands on.
CSLYL and JCdR Analyzed data and performed statistical analysis.
GLM performed urinary eicosanoid assays.
JLB, CAH Helped in preparation of the manuscript.
DG analyzed CLS density.
NMI helped analyze CLS density.
Acknowledgements
We thank the research volunteers and the Rockefeller University Hospital clinical research staff who made this study possible and Rhonda Yantis M.D. for reviewing adipose tissue biopsies. We thank Dr. Andrew J Dannenberg for reviewing the manuscript,Eileen Bailey B.S. for analysis of the fatty acid composition of plasma and red cell phospholipid and adipose tissues, and DSM Biosciences for providing the DHA capsules.
References
- 1.Protani M, Coory M, Martin J H.Effect of obesity on survival of women with breast cancer: systematic review and meta-analysis. , Breast Cancer Res Treat 123(3), 627-35.
- 2.Guilherme A, Virbasius J V, Puri V, Czech M P.Adipocyte dysfunctions linking obesity to insulin resistance and type 2 diabetes. , Nat Rev Mol Cell Biol 9(5), 367-77.
- 3.Harwood J L, Guschina I A.The versatility of algae and their lipid metabolism. , Biochimie 91(6), 679-84.
- 4.Siscovick D S, Barringer T A, Fretts A M, Wu J H, Lichtenstein A H et al. (2017) . Omega-3 Polyunsaturated Fatty Acid (Fish Oil) Supplementation and the Prevention of Clinical Cardiovascular Disease: A Science Advisory From the American Heart Association. Circulation 10-1161.
- 5.Friedberg C E, Janssen M J, Heine R J, Grobbee D E.Fish oil and glycemic control in diabetes. A meta-analysis. , Diabetes Care 21(4), 494-500.
- 6.Lalia A Z, Lanza I R.Insulin-Sensitizing Effects of Omega-3 Fatty Acids: Lost in Translation?. , Nutrients 8(6), 10-3390.
- 7.Galli C, Calder P C.Effects of fat and fatty acid intake on inflammatory and immune responses: a critical review. , Ann Nutr Metab 55(1), 123-39.
- 8.Cinti S, Mitchell G, Barbatelli G, Murano I, Ceresi E et al.Adipocyte death defines macrophage localization and function in adipose tissue of obese mice and humans. , J Lipid Res 46(11), 2347-55.
- 9.Bakker G C, van Erk MJ, Pellis L, Wopereis S, Rubingh C M et al.An antiinflammatory dietary mix modulates inflammation and oxidative and metabolic stress in overweight men: a nutrigenomics approach. , Am J Clin Nutr 91(4), 1044-59.
- 10.Simopoulos A P.An Increase in the Omega-6/Omega-3 Fatty Acid Ratio Increases the Risk for Obesity. , Nutrients 8(3), 128-10.
- 11.Caesar R, Tremaroli V, Kovatcheva-Datchary P, Cani P D, Backhed F.. Crosstalk between Gut Microbiota and Dietary Lipids Aggravates WAT Inflammation through TLR Signaling. Cell Metab 22(4), 658-68.
- 13.Dubois R N, Abramson S B, Crofford L, Gupta R A, Simon L S et al.Cyclooxygenase in biology and disease. , FASEB J 12(12), 1063-73.
- 14.Calder P C.Marine omega-3 fatty acids and inflammatory processes: Effects, mechanisms and clinical relevance. , Biochim Biophys Acta 1851(4), 469-84.
- 15.Heemskerk M M, Giera M, Bouazzaoui F E, Lips M A, Pijl H et al.. Increased PUFA Content and 5-Lipoxygenase Pathway Expression Are Associated with Subcutaneous Adipose Tissue Inflammation in Obese Women with Type 2 Diabetes. Nutrients 7(9), 7676-90.
- 16.LeMieux M J, Kalupahana N S, Scoggin S, Moustaid-Moussa N.Eicosapentaenoic acid reduces adipocyte hypertrophy and inflammation in diet-induced obese mice in an adiposity-independent manner. , J Nutr 145(3), 411-7.
- 17.Calder P C.n-3 fatty acids, inflammation and immunity: new mechanisms to explain old actions. Proc Nutr Soc 72(3), 326-36.
- 18.Lopategi A, Lopez-Vicario C, Alcaraz-Quiles J, Garcia-Alonso V, Rius B et al.Role of bioactive lipid mediators in obese adipose tissue inflammation and endocrine dysfunction. , Mol Cell Endocrinol 2016, 44-59.
- 19.Oh D Y, Talukdar S, Bae E J, Imamura T, Morinaga H et al.GPR120 is an omega-3 fatty acid receptor mediating potent anti-inflammatory and insulin-sensitizing effects. , Cell 142(5), 687-98.
- 20.Yates C M, Calder P C, Ed Rainger G.Pharmacology and therapeutics of omega-3 polyunsaturated fatty acids in chronic inflammatory disease. , Pharmacol Ther 141(3), 272-82.
- 21.Luo J, Rizkalla S W, Boillot J, Alamowitch C, Chaib H et al.Dietary (n-3) polyunsaturated fatty acids improve adipocyte insulin action and glucose metabolism in insulin-resistant rats: relation to membrane fatty acids. , J Nutr 126(8), 1951-8.
- 22.Ito M K.A Comparative Overview of Prescription Omega-3 Fatty Acid Products. , P T 40(12), 826-57.
- 23.Rangel-Huerta O D, Aguilera C M, Mesa M D, Gil A.Omega-3 long-chain polyunsaturated fatty acids supplementation on inflammatory biomakers: a systematic review of randomised clinical trials. , Br J Nutr 2012;107 Suppl 2-159.
- 24.Kabir M, Skurnik G, Naour N, Pechtner V, Meugnier E et al.Treatment for 2 mo with n 3 polyunsaturated fatty acids reduces adiposity and some atherogenic factors but does not improve insulin sensitivity in women with type 2 diabetes: a randomized controlled study. , Am J Clin Nutr 86(6), 1670-9.
- 25.Spencer M, Finlin B S, Unal R, Zhu B, Morris A J et al.Omega-3 fatty acids reduce adipose tissue macrophages in human subjects with insulin resistance. , Diabetes 62(5), 1709-17.
- 26.Itariu B K, Zeyda M, Hochbrugger E E, Neuhofer A, Prager G et al.Long-chain n-3 PUFAs reduce adipose tissue and systemic inflammation in severely obese nondiabetic patients: a randomized controlled trial. , Am J Clin Nutr 96(5), 1137-49.
- 27.Kratz M, Kuzma J N, Hagman D K, B van Yserloo, Matthys C C et al.n3 PUFAs do not affect adipose tissue inflammation in overweight to moderately obese men and women. , J Nutr 143(8), 1340-7.
- 28.Willett W C, Sampson L, Stampfer M J, Rosner B, Bain C et al.Reproducibility and validity of a semiquantitative food frequency questionnaire. , Am J Epidemiol 122(1), 51-65.
- 29.Wu X, Cai H, Xiang Y B, Cai Q, Yang G et al.Intra-person variation of urinary biomarkers of oxidative stress and inflammation. , Cancer Epidemiol Biomarkers Prev 19(4), 947-52.
- 30.Iyengar N M, Zhou X K, Gucalp A, Morris P G, Howe L R et al.. , Systemic Correlates of White Adipose Tissue Inflammation in Early-Stage Breast Cancer. Clin Cancer Res 22(9), 2283-9.
- 31.Yurko-Mauro K, Kralovec J, Bailey-Hall E, Smeberg V, Stark J G et al.Similar eicosapentaenoic acid and docosahexaenoic acid plasma levels achieved with fish oil or krill oil in a randomized double-blind four-week bioavailability study. Lipids Health Dis 2015;14: 99. 10-1186.
- 32.Folch J, Lees M, Sloane Stanley GH.A simple method for the isolation and purification of total lipides from animal tissues. , J Biol Chem 226(1), 497-509.
- 33.Morrison W R, Smith L M.Preparation of Fatty Acid Methyl Esters and Dimethylacetals from Lipids with Boron Fluoride--Methanol. , J Lipid Res 1964, 600-8.
- 34.Neff L M, Culiner J, Cunningham-Rundles S, Seidman C, Meehan D et al.Algal docosahexaenoic acid affects plasma lipoprotein particle size distribution in overweight and obese adults. , J Nutr 141(2), 207-13.
- 35.Subbaramaiah K, Howe L R, Bhardwaj P, Du B, Gravaghi C et al.Obesity is associated with inflammation and elevated aromatase expression in the mouse mammary gland. , Cancer Prev Res (Phila) 4(3), 329-46.
- 36.Andrews S.Internet: FastQC: a quality control tool for high throughput sequence data. Available online at: http://www.bioinformatics.babraham.ac.uk/projects/fastqc.
- 37.Dobin A, Davis C A, Schlesinger F, Drenkow J, Zaleski C et al.STAR: ultrafast universal RNA-seq aligner. , Bioinformatics 29(1), 15-21.
- 38.DeLuca D S, Levin J Z, Sivachenko A, Fennell T, Nazaire M D et al.RNA-SeQC: RNA-seq metrics for quality control and process optimization. , Bioinformatics 28(11), 1530-2.
- 39.Liao Y, Smyth G K, Shi W.featureCounts: an efficient general purpose program for assigning sequence reads to genomic features. , Bioinformatics 30(7), 923-30.
- 40.Love M I, Huber W, Anders S.Moderated estimation of fold change and dispersion for RNA-seq data with DESeq2. , Genome Biol 15(12), 550-10.
- 41.Iyengar N M, Morris P G, Zhou X K, Gucalp A, Giri D et al.Menopause is a determinant of breast adipose inflammation. , Cancer Prev Res (Phila) 8(5), 349-58.
- 42.Storlien L H, Kraegen E W, Chisholm D J, Ford G L, Bruce D G et al.Fish oil prevents insulin resistance induced by high-fat feeding in rats. , Science 237(4817), 885-8.
- 43.Fickova M, Hubert P, Cremel G, Leray C.Dietary (n-3) and (n-6) polyunsaturated fatty acids rapidly modify fatty acid composition and insulin effects in rat adipocytes. , J Nutr 128(3), 512-9.
- 44.Perez-Matute P, Perez-Echarri N, Martinez J A, Marti A, Moreno-Aliaga M J.Eicosapentaenoic acid actions on adiposity and insulin resistance in control and high-fat-fed rats: role of apoptosis, adiponectin and tumour necrosis factor-alpha. , Br J Nutr 97(2), 389-98.
- 45.Ruzickova J, Rossmeisl M, Prazak T, Flachs P, Sponarova J et al.Omega-3 PUFA of marine origin limit diet-induced obesity in mice by reducing cellularity of adipose tissue. , Lipids 39(12), 1177-85.
- 46.Kalupahana N S, Claycombe K J, Moustaid-Moussa N.(n-3) Fatty acids alleviate adipose tissue inflammation and insulin resistance: mechanistic insights. , Adv Nutr 2(4), 304-16.
- 47.Todoric J, Loffler M, Huber J, Bilban M, Reimers M et al.Adipose tissue inflammation induced by high-fat diet in obese diabetic mice is prevented by n-3 polyunsaturated fatty acids. , Diabetologia 49(9), 2109-19.
- 48.Puglisi M J, Hasty A H, Saraswathi V.The role of adipose tissue in mediating the beneficial effects of dietary fish oil. , J Nutr Biochem 22(2), 101-8.
- 49.Wang Y, Huang F.N-3 Polyunsaturated Fatty Acids and Inflammation in Obesity: Local Effect and Systemic Benefit. , Biomed Res Int 2015, 581469-10.
- 50.Guebre-Egziabher F, Debard C, Drai J, Denis L, Pesenti S et al.Differential dose effect of fish oil on inflammation and adipose tissue gene expression in chronic kidney disease patients. , Nutrition 29(5), 730-6.
- 51.Haghiac M, Yang X H, Presley L, Smith S, Dettelback S et al.Dietary Omega-3 Fatty Acid Supplementation Reduces Inflammation in Obese Pregnant Women: A Randomized Double-Blind Controlled Clinical Trial. , PLoS One 10(9), 10-1371.
- 52.Farb M G, Bigornia S, Mott M, Tanriverdi K, Morin K M et al.Reduced adipose tissue inflammation represents an intermediate cardiometabolic phenotype in obesity. , J Am Coll Cardiol 58(3), 232-7.
- 54.Martinez-Fernandez L, Laiglesia L M, Huerta A E, Martinez J A, Moreno-Aliaga M J.Omega-3 fatty acids and adipose tissue function in obesity and metabolic syndrome. Prostaglandins Other Lipid Mediat 2015;121(Pt A): 24-41.
- 55.Denis G V, Obin M S.Metabolically healthy obesity': origins and implications. , Mol Aspects Med 34(1), 59-70.
- 56.Phillips C M.Metabolically healthy obesity across the life course: epidemiology, determinants, and implications. , Ann N Y Acad Sci 1391(1), 85-100.
- 57.Walker C G, Browning L M, Mander A P, Madden J, West A L et al.Age and sex differences in the incorporation of EPA and DHA into plasma fractions, cells and adipose tissue in humans. , Br J Nutr 111(4), 679-89.
- 58.Breslow J L. (2006) n-3 fatty acids and cardiovascular disease. Suppl): 1477S-82S , Am J Clin Nutr
- 59.Mozaffarian D, Wu J H.(n-3) fatty acids and cardiovascular health: are effects of EPA and DHA shared or complementary?. , J Nutr 142(3), 614-25.
- 60.Allaire J, Couture P, Leclerc M, Charest A, Marin J et al.A randomized, crossover, head-to-head comparison of eicosapentaenoic acid and docosahexaenoic acid supplementation to reduce inflammation markers in men and women: the Comparing EPA to DHA (ComparED) Study. , Am J Clin Nutr 104(2), 280-7.
Cited by (23)
This article has been cited by 23 scholarly works according to:
Citing Articles:
Prostaglandins, Leukotrienes and Essential Fatty Acids (2024) Crossref
Prostaglandins Leukotrienes and Essential Fatty Acids (2024) OpenAlex
Lea Gründler, Philine Beinhorn, Andreas Hahn, J. Schuchardt - Prostaglandins, Leukotrienes and Essential Fatty Acids (2024) Semantic Scholar
International Journal of Molecular Sciences (2024) Crossref
International Journal of Molecular Sciences (2024) OpenAlex
S. Tait, E. Calura, A. Baldassarre, Andrea Masotti, B. Varano et al. - International Journal of Molecular Sciences (2024) Semantic Scholar
J. Schuchardt, Philine Beinhorn, X. Hu, Hing Man Chan, K. Roke et al. - Progress in lipid research (2024) Semantic Scholar
Nutrition (2023) Crossref
Nutrition (2023) OpenAlex
Frontiers in Medicine (2022) Crossref
Frontiers in Medicine (2022) OpenAlex
M. Abshirini, Jane Coad, F. Wolber, P. V. von Hurst, Matthew R. Miller et al. - Frontiers in Medicine (2022) Semantic Scholar
Cells (2021) Crossref
Cells (2021) OpenAlex
Manuela Del Cornò, R. Varì, Beatrice Scazzocchio, B. Varano, R. Masella et al. - Cells (2021) Semantic Scholar
Journal of Diabetes and its Complications (2020) Crossref
Cancers (2020) Crossref
Cancers (2020) OpenAlex
Giuseppina Augimeri, C. Giordano, L. Gelsomino, P. Plastina, I. Barone et al. - Cancers (2020) Semantic Scholar
Journal of Diabetes and its Complications (2019) OpenAlex
V. Saraswathi, R. Heineman, Y. Alnouti, V. Shivaswamy, C. Desouza - Journal of diabetes and its complications (2019) Semantic Scholar
Journal of Cancer Metastasis and Treatment (2019) OpenAlex
L. Conti, Manuela Del Corn, Beatrice Scazzocchio, Rosaria Var, M. D'Archivio et al. - Journal of Cancer Metastasis and Treatment (2019) Semantic Scholar
Marine Drugs (2018) Crossref
Marine Drugs (2018) OpenAlex
K. Adamcova, O. Horakova, K. Bardova, P. Janovska, Marie Brezinova et al. - Marine Drugs (2018) Semantic Scholar
Okechukwu Getrude, Nweke B. Ofobuike, Uchewa O. Obinna, Ezemagu K. Uchenna, Ibegbu O. Augustine - Journal of Advances in Medicine and Medical Research (2018) Semantic Scholar
International Journal Of Nutrition (2017) OpenAlex