
Age Variation in Bitter Taste Perception in Relation to the Tas2r38 Taste Receptor Phenotype
Abstract
Objectives
Taste sensitivity is an important determinant of food choice and differs between children and adults. This difference is probably due to several factors that constitute an individual’s phenotype. The aim of this study was to explore taste perception in relation to the TAS2R38 and CAVI (gustin) genotypes in age classes from infancy to adulthood in a Mediterranean population.
Methods
In this cross-sectional study we evaluated the TAS2R38 and gustin genotypes and administered a standardized PROP taste test in 705 individuals (435 adults, 270 children); the sample included 224 mother-child dyads. We also explored the acceptance and consumption of bitter and non-bitter vegetables.
Results
Sensitivity to bitterness was strongly related to the TAS2R38 haplotype, and we observed an intriguing relationship with age. In fact, children were more sensitive than adults with the same TAS2R38 haplotype also within mother-child dyads. The mother-child tasting differences decreased with age and became minimal when children reached adolescence. Variations in the gustin gene did not contribute significantly to the overall taste phenotype, but helped to differentiate among non-tasters.
Conclusions
The genetic profile of the bitter-taste receptor TAS2R38 explains most of the variance in bitter taste perception, but the related phenotype is also strongly influenced by age, also in mother-child dyads that share the same genotype. This finding is likely to have a significant impact on the complex feeding relationship between mother and child.
Author Contributions
Academic Editor: Kavitha menon, Research fellow , Human Nutrition, University of Otago , Dunedin, Newzealand
Checked for plagiarism: Yes
Review by: Single-blind
Copyright © 2015 Rossella Negri, et al.
 This is an open-access article distributed under the terms of the Creative Commons Attribution License, which permits unrestricted use, distribution, and reproduction in any medium, provided the original author and source are credited.
Competing interests
The authors have declared that no competing interests exist.
Citation:
Introduction
Recent discoveries related to the molecular domain of human taste have opened new avenues for the study of the relationship between inherited factors and food behaviour 1, 2. This is particularly important in children because an unprecedented change in food choices is modifying the shape of generations of children in affluent societies and in the upper class of developing countries as well as their health status. The ongoing epidemic of childhood obesity, which is particularly notable in the Campania Region (southern Italy), cannot be attributed to the advent of industrial foods alone. Indeed, current genomic profiles developed over thousands of years, while environmental changes are only one-generation old. Consequently, the relationship between genomic profile and food choice should be explored in relation to age and family environment.
Food acceptance in children is clearly related to the inherited genomic profile of taste receptors, much more than in adults, since environmental and cultural factors experienced during the life have a strong relevance in shaping taste preferences.
In fact, they much prefer sweet (energy) and reject bitter (potentially toxic) foods; consequently, they tend to avoid low energy-density foods like vegetables and fruit, and favour high-energy density-rich food such as sugars and fats3
To date, the most studied genotype-phenotype association related to taste is the one of Phenylthiocarbamide (PTC) and the related compound 6-n-propylthiouracil (PROP), both not found in nature, which sensitivity closely related to common genetic variants in the TAS2R38 gene located on chromosome7
PROP bitter taste sensitivity appears to be a marker of a wide variety of factors that condition food choices. Indeed, hypersensitivity to propylthiouracil (PROP) is associated to heightened responses to sweeteners5 and salt6, as well as to such chemesthetic 7, 8 and somatosensory9, 10 sensations as the feel of astringency and the hotness of fats in the mouth11
Therefore, the PROP bitter taste phenotype is considered a general marker of oral sensitivity that is able to influence food selection and body weight12, 13, 14, 15, 16, 17.however, these results were not confirmed by other studies18, 19.
Individuals are usually classified as being PROP bitter insensitive, sensitive or super sensitive according to the perceived intensity of the PROP solutions4.In this context, the salivary protein gustin (CAVI) that has been implicated in taste bud growth and maintenance was implicated in the control of PROP phenotype 21, 22. We previously confirmed the relationship between the TAS2R38 genotype and the PROP taste phenotype in children and adults, and observed a difference in this relationship between children and adults carrying the same genotype20.The aim of the present study was to examine systematically in a cross-section study how TAS2R38 and CAVI polymorphisms affect bitter taste perception and food preference in relation to age and sex. We also explored the feeding behaviour of children in relation to their mother’s food preferences in order to stratify for familial environment and shared or unshared genomic profile.
Materials and Methods
Study Population
705 healthy individuals from southern Italy (435 adults and 270 children; the sample included 224 mother-child dyads), were enrolled in the study. All were Caucasian, and resided in the same geographic area (Campania) for at least two generations. The average age of adults was 31.17 years (± 12.83 S.D.). One-hundred children were aged between 1 and 6 years, 151 between 7and 12 years and 23 between 13 and 8 years; their body mass index ranged between the 5th and the 85th percentiles. This study was conducted according to the guidelines of the Declaration of Helsinki 2008 and all procedures involving human subjects and patients were approved by the Ethics Committee of the University of Naples Federico II. Mothers gave written informed consent for themselves and their children.
PROP Sensitivity Assessment
Adults and children above the age of 6 were requested to refrain from eating and drinking for at least 1 hour before the bitter taste test. In ascending order, subjects tasted two suprathreshold PROP solutions, namely 280 mM and 560 mM (Aldrich Chemical, Milwaukee, WI, USA) in distilled water, rinsing their mouth with water before and after each test solution as reported elsewhere18. Children were instructed not to swallow the test solutions and, if required, underwent brief training to sip and spit water. Taste sensation was assessed on a 4-point scale in which the labels “no taste”, “weakly unpleasant” (bitter, barely perceptible), “unpleasant” (bitter), and “very unpleasant” (extremely bitter) corresponded to values ranging from 0 to 3. We used a 4-point scale to assess the phenotype because individuals tend to select the middle number in a span of 3 numbers.
To assess taste sensation in very young children (< 6 years old) we used a hedonic scale rating of four facial movements made by the child when exposed to the taste test. A neutral expression = no taste (0); depression of mouth corners = a weakly unpleasant taste (1); frown and depression of mouth corners = unpleasant taste (2); frown and grimace = a very unpleasant taste (3). In fact, corner elevation of lip and mouth, grimace and frowning are landmarks of the reaction to bitterness 23, 24,. Facial expressions were recorded and analyzed by two independent observers. In case of dubious expressions, the child was retested and his/her mother helped to interpret the child’s expression. Based on the score, subjects were classified as non-tasters (score 0–2), medium tasters (score 3–4), and super tasters (score 5–6). The score is based on the two PROP solutions.
For quality control, a random sample of 30 adults was tested for threshold sensitivity using a standard forced-choice procedure 25 . Six PROP solutions, (0.032; 0.1; 0.32; 0.56; 1; 3.2 mM) were used and threshold values were identified as the first concentration correctly chosen in two subsequent presentations. Subjects were classified as non-tasters if the threshold was ≥ 0.15mM, and tasters if the threshold was ≤ 0.1 mM PROP. The phenotype assessment was validated by comparing the means of the two methods (threshold and suprathreshold) with a significant correlation (Cohen’s k=0.439, P=0.011).
In addition, a random sample of 20 children (age < 6 years) and 58 adults (age 24-60 year) underwent a second supra-threshold test to assess the consistency of PROP taste assessment. We found a strong correlation between the first and second test (Pearson r = 0,627, Spearman r=0.617). and the correlation was better for small children (Pearson r =0.806; Spearman r=0.808) than for adults (Pearson r = 0.515; Spearman r=0.503). The average of the differences (absolute values) between the first and the second test was 0.53 (95% C.I. 0.39-0.69). The coefficient of variation was equal to 22.3%. Most of the retests were within ±0.5 on the 4 points scale.
Genotyping
Genetic analyses were conducted on genomic DNA obtained from saliva with the phenol-chloroform extraction method, following a protocol developed in our laboratory. TAS2R38 gene C145G (rs713598), C785T (rs1726866), G886A (rs10246939) and CAVI A268G (rs2274333) polymorphisms were determined by means of RT-PCR. Allelic Discrimination Assay with Applied Biosystems 7900HT fast thermal cycler, using allele-specific probes (TAS2R38rs713598: C__8876467_10; TAS2R38rs1726866:C__9506827_10; TAS2R38rs10246939: C__9506826_10, CAVIrs2274333: C__1739329_10) and primers from Applied Biosystems (Life Technologies Corporation CA, USA), according to standard Taqman SNP Genotyping assay protocol. All subjects were typed for the three polymorphic sites of TAS2R38, corresponding to the amino acid substitutions A49P, V262I, I296V, that give rise to the most common haplotypes PAV and AVI. A total of 265 (198 adults and 67 children) were also typed for the gustin/CAVI gene polymorphism rs2274333. Children of the mother-child dyads were excluded from the analysis of population prevalence because their data were not independent of those of their mothers.
Food Acceptance
We used a pictorial food frequency questionnaire to estimate the total weekly consumption of bitter–tasting vegetables (cabbage, broccoli, cauliflower, spinach, rocket, radicchio) and non-bitter vegetables (lettuce, roman salad, escarole, tomato, zucchini, eggplant). Pictures of each vegetable were shown to the mothers of children < 8 years old to estimate their child’s food choices. Preference scores for legumes, bitter and non-bitter tasting greens were estimated by a 4-point scale ranging from “highly liked” (score 4) to “disliked most” (score 0) for each single item. A global estimate was obtained by summing the scores of each food item within the class of legumes, bitter vegetables and non bitter vegetables. Similarly the weekly consumption of each vegetable was recorded and a global score of weekly food consumption was obtained by summing the reported weekly consumption of each vegetable within the class of legumes, bitter and non bitter vegetables. Within the 224 mother-child dyads, the difference in the global score of food preferences and consumption was obtained by subtracting child’s score from his/her mother’s score, stratified for shared/unshared genotype.
Retrospective food analysis questionnaires are open to significant random variation due to inaccuracy of the mother’s report. We attempted to control for this variance by: (i) using a pictorial questionnaire that shows the food item to be questioned; (ii) an experienced dietician who verified the accuracy of the food item questionnaires; and (iii) 22 food questionnaires were repeated by two independent operators. The difference between the two sets of questionnaires was evaluated with the Wilcoxon rank sum test. No significant differences were found between the two observers regarding the liking and consumption questionnaires. Indeed, the greatest difference in liking was recorded for the bitter vegetables (mean 0.27), which corresponds to a 3% coefficient of variation of the grand mean of the estimated liking. Regarding the frequency of food consumption, the greatest difference was observed for bitter vegetables, the mean of which being 0.068 that corresponds to a 3.13% coefficient of variation.
Statistical Analysis
Variables were screened for their distribution, and parametric or non parametric test adopted accordingly. Analysis of variance (ANOVA) was performed to compare groups with a significance level of 0.05, using sex and age as covariates, after controlling for normality of distribution. Concordances between the different methods used to assess PROP bitterness were evaluated using Cohen’s kappa. Data were analyzed using SPSS 19.0 (SPSS Inc, Chicago, IL) and PLINK software (http://pngu.mgh.harvard.edu/~purcell/plink/) 26.
Results
PROP Phenotypes
PROP sensitivity was measured using the suprathreshold method in 705 subjects, 435 adults and 270 children. There were 214 (30.4%) non-tasters, 276 (39.1%) medium-tasters, and 215 (30.5 %) supertasters. Sensitivity to bitterness differed significantly between children and adults, with more supertasters among children (113/270; 41.9%) and more non tasters among adults (152/435; 34.9%), chi square = 28,1 p < 0.0001. No sex differences were observed for children, but significantly fewer adult females were non tasters and more were supertasters compared to adult males (chi square = 6.6 p < 0.037; Table 1). Sensitivity to bitterness increased constantly with age in children (Figure 1): 50% of 3-year-old children were non tasters versus only 26% of teenagers (14-18 years old); similarly the per cent of super-tasters increased from 21% to 52% in the latter group (chi square for trend 9.08 p = 0.002).
Table 1. Sensitivity to bitter taste by sex in children and adults| Adults | Status | Male | Female | Total |
| Non taster | 31 (49.2%) | 121 (35.2%) | 152 (34.9%) | |
| Taster | 20 (31.7%) | 161 (43.3%) | 181 (41.6%) | |
| Super taster | 12 (19%) | 90 (24.2%) | 102 (23.4%) | |
| Total | 63 | 372 | 435 | |
| Children | Status | Male | Female | Total |
| Non taster | 38 (24.8%) | 24 (20.5%) | 62 (23%) | |
| Taster | 56 (36.6%) | 39 (33.3%) | 95 (35.2%) | |
| Super taster | 59 (38.6%) | 54 (46.2%) | 113 (41.9%) | |
| Total | 153 | 117 | 270 |
Sensitivity to bitter differed significantly between children and adults, with more supertasters among children and more non tasters among adults. No sex differences were observed for children, but among adults significantly less females were non tasters and more were supertasters
Figure 1.Sensitivity to bitterness by age.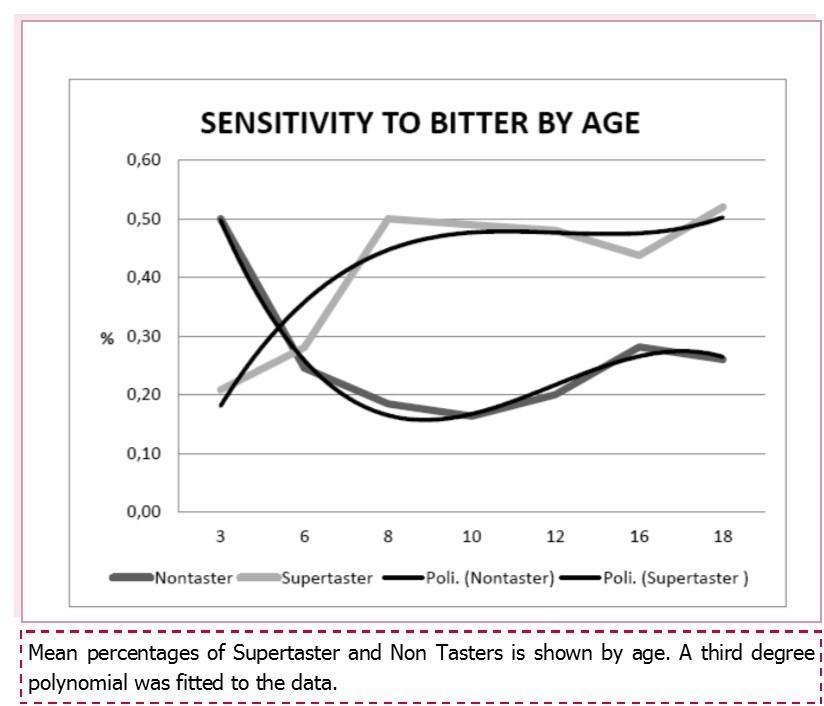
TAS2R38 Haplotypes
Haplotype analysis performed in 517 individuals revealed that about 25% of the sample were homozygous for the sensitive haplotype PAV, while 18.4 % were homozygous for the non functional haplotype AVI and 47% were PAV/AVI heterozygous. Other variants accounted for less than 10% (Table 2). Because of the presence of mother and child pairs, we recalculated the frequencies excluding randomly one member of the couple: but the results were completely overlapping with those shown. These frequencies were obviously not different by sex and age.
Table 2. Frequency of the TAS2R38 diplotypes| TAS2R38 Diplotype | FREQUENCY | PERCENTAGE |
| AVI/AVI | 95 | 18.4 |
| PAV/AVI | 243 | 47.0 |
| PAV/PAV | 129 | 25.0 |
| PAV/AAV | 22 | 4.3 |
| AVI/AAV | 23 | 4.4 |
| OTHERS | 5 | 1.0 |
| Total | 517 | 100.0 |
The most common haplotypes in the Caucasian population, PAV and AVI recurred as common diplotypes PAV/PAV, PAV/AVI, AVI/AVI in 90.4 % of the subjects, the less common haplotype AAV was present in 8.7 % of the sample, the rare haplotypes (AVV, PVV, AAI) in 1% of the population, as expected
Gustin Genotypes
The results of the genotyping of the gustin gene polymorphism A286G performed in 340 individuals, showed a higher frequency of the A allele (71.3%) compared to G allele (28.7%). At genotypic level, 170 (50%) were homozygous AA, 139 (40.9%) heterozygous AG, while 31 (9.1%) were homozygous GG (Table 3). Given the rarity of the gustin GG genotype we could not explore its effect in detail; however, the GG genotype was significantly less frequent (2/64 = 3.1%) in non-tasters carrying the expected AVI haplotype than in non-tasters carrying the functional PAV haplotype (5/38 = 13.2%). Conversely, the gustin AA genotype was significantly more frequent (34/64 = 53.1%) in AVI non-tasters than in PAV non-tasters (14/38 = 36.8%, chi square = 4.826 p = 0.0028).
Table 3. Distribution of gustin genotypes in unrelated individuals.| Allele | % | Genotype | Frequency | % |
| AG | 71.328.7 | AAAGGG | 170 139 31 | 50.040.9 9.1 |
| Total | 100 | Total | 340 | 100 |
Genotype-Phenotype Association
Sensitivity to PROP was strongly related to the TAS2R38 haplotype in children and adults (chi square = 150 p < 0.00001). However, as shown in Table 4, 75% of carriers of the AVI haplotype (AVI/AVI, AVI/AAV) were non-tasters, and 83.7% of PAV homo- or heterozygous were tasters or supertasters. Interestingly, PAV children were as sensitive to bitterness (126/143; 88.1%) as PAV adults (222/249; 81.1%), but significantly fewer AVI children were non-tasters (23/38; 60.5%) than AVI adults (63/77; 81.8%, chi square = 6.11 p = 0.013). Similar differences were observed in AVI or PAV homozygous : 95.5% (43/45) of adults and 92.8% (65/70) of children were tasters/supertasters while 53/63 (84.1%) AVI/AVI adults were non-tasters versus 20/31 (64.5%) AVI/AVI children.
Table 4. Genotype-phenotype correlation| T2R38 | STATUS | TOTAL | ||
| NON TASTER | TASTER | SUPER TASTER | ||
| AVIa | 86 (74.8%) | 24 (20.9%) | 5 (4.3%) | 115 |
| PAVb | 64 (16.3%) | 178 (45.4%) | 150 (38.3%) | 392 |
| RARE GENOTYPES | 2 (40.4%) | 1 (20%) | 2 (40%) | 5 |
| TOTAL | 152 (29.7%) | 203 (39.6%) | 157 (30.7%) | 512 |
Sensitivity to the bitter compound (tasting phenotype) was strongly related to the TAS2R38 haplotype, but the association between genotype and phenotype was more stringent for the PAV haplotype.
Food Preferences, Age and Prop Status
Bitter and non-bitter tasting vegetables preferences (consumption and liking) were calculated for all age groups. As shown in Figure 2, both bitter and non-bitter tasting greens intake increased significantly with age (ANOVA; F=20.17, p<0.0001 and F=13,93 , p < 0,0001). As previously reported, no association was found between bitter and non-bitter tasting vegetables neither with PROP phenotypes nor haplotypes.
Figure 2.Mean (+/-95% C.I.) weekly intake of non bitter (continuous line) and bitter (dashed line) by age.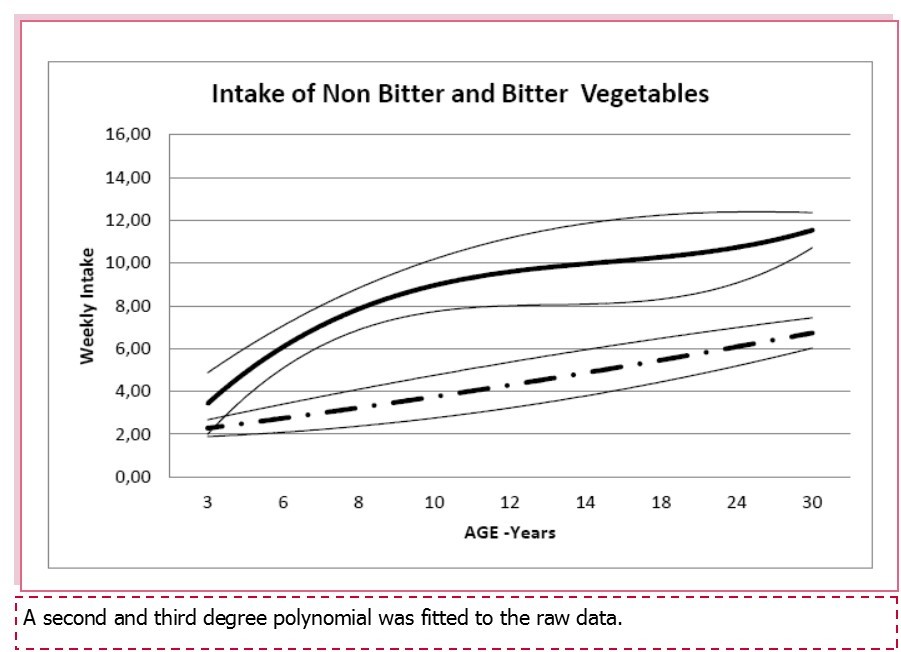
Children Versus Mothers
In the mother-child dyads, the child was generally more sensitive to PROP than the mother. In fact, in 32% of the pairs the number of medium/supertaster children exceeded that of mothers, while in only 15% of the pairs the mother was more sensitive than the child. In the remaining 53% of dyads, mothers and children shared phenotype irrespective of genotype. A comparison of the global preference score (consumption + fondness) of both bitter and non bitter tasting vegetables within the dyads revealed striking differences between the child and the mother (mean preference score= 9.7) for non-bitter tasting greens, and particularly for the bitter tasting greens (mean preferences score= 11.2). These differences decreased with the age of the child: adolescents showed a trend “more compatible” with that of their mothers (Pearson correlation r=-0.308 for non-bitter vegetables; r=-0.174 for bitter tasting ones; both P <0.05).
In addition, the TASR38 haplotypes affected the differences between children and mothers for non-bitter (ANOVA; F=6.28, P=0.003) and bitter tasting vegetables (ANOVA; F= 11.3; P<0.001). Children with the PAV haplotype, in fact, had almost a double distance from their mothers compared to those carrying the AVI haplotype (10.23 vs. 5.25 ANOVA; F=6.3, P=0.003 for non-bitter vegetables; 11.13 vs. 8.0 points, ANOVA; F=11.4, P<0.001 for bitter vegetables) (Table 5). At ANOVA, the child’s haplotype was the best contributor to the variance (F= 5.05, P=0.05 for non-bitter and F=5.68, P=0.005 for bitter tasting vegetables), while the maternal haplotype did not contribute significantly to the intra-couple difference in the consumption of the foods investigated (F=0.25 and F=0.20, with both P>0.05).
Table 5. Differences (Δ) in vegetables preferences between mothers and AVI or PAV children| Children’s haplotype | Mother/child difference for non bitter greens | Mother/child difference for bitter greens | p-value | |
| AVI | Mean | 5.25 | 8 | 0.003 |
| S.D. | 7.85 | 7.55 | ||
| PAV | Mean | 10.23 | 11.13 | 0.0001 |
| S.D. | 8.38 | 6.25 |
Discussion
The main aim of this study was to evaluate in a Mediterranean population whether PROP genotypes/phenotypes influence feeding behaviour in children and adults, and in mother–child dyads. Here we confirm our previous finding, obtained in a smaller sample20, that PROP sensitivity differs between children and adults. In fact, the frequency of supertasters was higher in children, even in mother-child dyads sharing the same TAS2R38 haplotype. Sensitivity to PROP bitterness was strongly influenced by the TAS2R38 genotype and only marginally influenced by gustin gene polymorphisms. Concordance between PROP bitter sensitivity and the expected tasting haplotype (PAV) was gradually reached as children approached adolescence. Age-related changes in PROP sensitivity was particularly evident in genetic non tasters (AVI homozygous) in whom the genotype-phenotype concordance decreased from 84% in adults to 66% in children. The taster PAV diplotype was less affected by age: the proportions of tasters and supertasters were similar in adults and children with the PAV haplotype. This is in accordance with Mennella et al. 27 who reported that AVI/PAV children, but not adults, perceived a bitter taste at low PROP concentrations, whereas no such effect occurred in AVI or PAV homozygous.
Other factors besides age have been implicated in PROP sensitivity. Calò et al. 21 reported that, in a genetically homogeneous cohort, bitter sensitivity might be influenced by the polymorphic site A286G in the taste bud growth factor gustin/CAVI gene, as well by salivary zinc ion concentration. However, Melis et al. 22 reported that, among PAV homo- and heterozygous, the supertaster status is not more frequently associated to the AA genotype. In line with the findings of Feeney et al. 28, and Tomassini Barbarossa et al., 29 we did not find a correlation between CAVI polymorphisms and the PROP phenotype.In fact, the frequency of the gustin genotypes was not associated with the TAS2R38 genotypes or with the bitter sensitivity phenotypes. It is a taste-modifying gene, with no overall implication in producing the tasting phenotype.
PROP responsiveness is also linked to the secretion of salivary peptides from the basic proline-rich protein family. In fact, these peptides were found to be more abundant in supertasters than in non-tasters and their concentration in saliva was increased by PROP stimulation 30 ,which suggests that PROP sensitivity could be more complex than hitherto thought.
Genetic and/or environmental modifiers could contribute, albeit it to different degrees, to the definition of the phenotype throughout life. Changes in gene expression in the development phase or hormonal influences around the time of puberty may account for a different penetrance of the TAS2R38 genotypes at different ages. Furthermore, individual differences in the expression of the PAV haplotype among heterozygous may account for the variation in bitter taste perception 31 . Consequently, PROP sensitivity should be considered a quantitative rather than a qualitative trait, and a continuum of intermediate levels of responsiveness probably separate the insensitive phenotype from the hypersensitive phenotype 32.
Although several studies support the relationships between PROP taster status and food preferences 33, 34, 35, 36, 37 others do not 18, 19, 38. In our population, the consumption of bitter and non-bitter tasting vegetables did not appeared to be related to PROP sensitivity or to TAS2R38 haplotype. However, we found that the acceptance and consumption of both kinds of greens increased with age irrespective of the PROP taster phenotype. These findings are not surprising given the evidence that other taste genes contribute to determining food selection 39, 40, 41, 42, 43 and to the supertaster phenotype 44. Indeed, enhanced global sensory acuity may be uncoupled from genetic sensitivity to PROP 45, 46. This concept suggested a new kind of phenotype, and the term “general supertaster” was coined to describe individuals more responsive to all or most oral stimuli, regardless of their TAS2R38 genotype 47. Sociocultural factors rather than PROP status could influence cruciferous vegetable consumption as shown by Baranowski et al. 48 in children from the USA; however, the burden of cultural differences is very limited in our cohort because it is constituted totally by individuals of Caucasian origin resident in Campania (south Italy) for at least two generations. On the other hand, foods are complex mixtures of different components, and bitterness may result from chemically different compounds that could interact with more than one taste receptor. Bitter sensitivity in humans is linked to 25 different receptors of the T2R family thereby providing a receptacle to a wide range of molecules 49, 50.
Regarding food preferences within the mother-child dyads, we show that the difference between mothers and children in terms of acceptance and consumption of greens decreased with the age of children, and it was significantly related to the children’s TAS2R38 haplotype. Because only 68.9% of the mothers shared the same TAS2R38 haplotype with their children, these differences could explain a significant proportion of the discrepancy in food consumption between mothers and children. Consumption of vegetables depends largely on age and less on the specific sensing genotype. Within the mother-child dyads, the differences in food preference were related to age, and to the specific genotype of the child. Because mothers are not aware of the tasting genotype of their children, they may feel that their child’s refusal to eat vegetables is a problem of relationship and behaviour and not of taste. In fact, as shown in this and other studies 12, 14, 51, 52, food preferences are also strongly influenced by cultural and environmental factors as well as by genetic factors. Further studies on the expression of taste receptors are going on in our laboratory in the attempt to better understand “when” taste sensitivity are changing and “what” may affect them, both key points to unravel the biological bases of food choices. Therefore, there is ample scope to continue to explore this domain given the impact of food choices on the health and quality of life of our species.
References
- 1.Grimm E R, Steinle N I. (2011) Genetics of eating behavior: established and emerging concepts. , Nutr Rev 69(1), 52-60.
- 2.Reed D R.Knaapila A.(2010). Genetics of taste and smell: poisons and pleasures. Prog Mol Biol Transl Sci.94: 213-40.
- 3.Mennella J A, Pepino M Y, Reed D R. (2005) Genetic and environmental determinants of bitter perception and sweet preferences. , Pediatrics 115, 216-22.
- 4.Kim U K, Jorgenson E, Coon H, Leppert M, Risch N. (2003) Positional cloning of the human quantitative trait locus underlying taste sensitivity to phenylthiocarbamide. , Science 299, 1221-5.
- 5.Duffy V B, Hayes J E, Dinehart M E. (2006) Genetic differences in sweet taste perception. Optimising the sweet taste in foods. Spillane WJ, editor , Cambridge: Woodhead 30-53.
- 6.Bartoshuk L M, Duffy V B, Lucchina L A, Prutkin J, Fast K. (1998) PROP (6-n-propylthiouracil) supertasters and the saltiness of NaCl. , Ann N Y Acad Sci 855, 793-6.
- 7.Prescott J, Swain-Campbell N. (2000) Responses to repeated oral irritation by capsaicin, cinnamaldehyde and ethanol in PROP tasters and non-tasters. Chem Senses. 25, 239-246.
- 8.Pickering G J, Gordon R. (2006) Perception of mouthfeel sensations elicited by red wine are associated with sensitivity to 6-N-propylthiouracil. , J Sens Stud 21, 249-265.
- 9.Prutkin J, Fisher E M, Etter L, Fast K, Gardner E. (2000) Genetic variation and inferences about perceived taste intensity in mice and men. , Physiol Behav 69, 161-173.
- 10.Hayes J E, Duffy V B. (2007) Revisiting sugar-fat mixtures: sweetness and creaminess vary with phenotypic markers of oral sensation. , Chem Senses 32, 225-236.
- 11.Yackinous C A, Guinard J X. (2002) Relation between PROP taster status and fat perception, touch, and olfaction. , Physiol. Behav 72, 427-37.
- 12.Robino A, Mezzavilla M, Pirastu N, Dognini M, Tepper B J. (2014) A population-based approach to study the impact of PROP perception on food liking in populations along the Silk Road. PLoS One.9(3):e91716
- 13.Tepper B J, White E A, Koelliker Y, Lanzara C.d'Adamo P,et al.(2009) Genetic variation in taste sensitivity to 6-n-propylthiouracil and its relationship to taste perception and food selection. , Ann N Y Acad Sci.1170: 126-39.
- 14.Hayes J E, Feeney E L, Allen A L. (2013) Do polymorphisms in chemosensory genes matter for human ingestive behavior? Food Qual Prefer. 30, 202-216.
- 15.Keller K L, Olsen A, Cravener T L, Bloom R.Chung WK et al.(2014) Bitter taste phenotype and body weight predict children’s selection of sweet and savory foods at a palatable test-meal. , Appetite 77, 113-21.
- 16.Sharma K, Kaur G K. (2014) PTC bitter taste genetic polymorphism, food choices, physical growth in body height and body fat related traits among adolescent girls from Kangra Valley, Himachal Pradesh (India). , Ann Hum Biol 41, 29-39.
- 17.Feeney E, O'Brien S, Scannell A, Markey A, Gibney E R. (2011) Genetic variation in taste perception: does it have a role in healthy eating?. Proc Nutr Soc 70, 135-43.
- 18.R D Mattes. (2004) 6-n-propylthiouracil taster status: dietary modifier, marker or misleader? Genetic Variation in Taste Sensitivity. , New York, J. Prescott & B.J. Tepper, Eds.: 229-250.
- 19.Drewnowski A, Henderson S A, Cockroft J E. (2007) Genetic sensitivity to 6-n-propylthiouracil has no influence on dietary patterns, body mass indexes , or plasma lipid profiles of women. , J. Am. Diet. Assoc.107: 1340-1348.
- 20.Negri R, M Di Feola, S Di Domenico, Scala M G, Artesi G. (2012) Taste perception and food choices. , J Pediatr Gastroenterol Nutr 54, 624-9.
- 21.Calò C, Padiglia A, Zonza A, Corrias L, Contu P. (2011) Polymorphisms in TAS2R38 and the taste bud trophic factor, gustin gene co-operate in modulating PROP taste phenotype. , Phys & Behavior 104, 1065-71.
- 22.Melis M, Atzori E, Cabras S, Zonza A, Calò C. (2013) . The Gustin (CAVI) Gene Polymorphism, rs2274333 (A/G), as a Mechanistic Link between PROP Tasting and Fungiform Taste Papilla Density and Maintenance. PLoS One 8(9).
- 23.Resurreccion A V, Paguio L P. (1996) Age appropriate hedonic scales to measure food preferences of young children. , J. Sensory Studies 11, 141-163.
- 24.Steiner J E, Glaser D, Hawilo M E, Berridge K C. (2001) Comparative expression of hedonic impact: affective reactions to taste by human infants and other primates. , Neurosc.Behav.Rev.25: 53-74.
- 25.Anliker J A, Bartoshuk L, Ferris A M, Hooks L D. (1991) Children’s food preferences and genetic sensitivity to the bitter taste of 6-n-propylthiouracil (PROP). , Am J Clin Nutr 54, 316-20.
- 26.Purcell S, Neale B, Todd-Brown K. (2007) PLINK: a tool set for whole-genome association and population-based linkage analyses. , Am J Hum Genet 81, 559-75.
- 27.Mennella J A, Pepino M Y, Duke F F, Reed D R. (2010) Age modifies the genotype-phenotype relationship for the bitter receptor TAS2R38. , BMC Genet 1, 11-60.
- 28.Feeney E L, Hayes J E. (2014) Exploring associations between taste perception, oral anatomy and polymorphisms in the carbonic anhydrase (gustin) gene CAVI. Physiol Behav.128:. 148-54.
- 29.Tomassini Barbarossa I, Melis M, M Z, Calò C, Muroni P. (2015) The gustin (CAVI) gene polymorphism, rs2274333 (A/G), is associated with fungiform papilla density, whereas PROP bitterness is mostly due to TAS2R38 in an ethnically-mixed population. , Physiology & Behavior 138, 6-12.
- 30.Cabras T, Melis M, Castagnola M, Padiglia A, Tepper B J. (2012) Responsiveness to 6-n-propylthiouracil (PROP) is associated with salivary levels of two specific basic proline-rich proteins in humans. , PLoS One 7, 30962.
- 31.Lipchock S V, Mennella J A, Spielman A I, Reed D R. (2013) Human bitter perception correlates with bitter receptor messenger RNA expression in taste cells. , Am J Clin Nutr. Oct;98: 1136-43.
- 32.Hayes J E, Keast R S. (2011) Two decades of supertasting: where do we stand? Physiol Behav. 104, 1072-4.
- 33.Drewnowski A, Henderson S A, Levine A, Hann C. (1999) Taste and food preferences as predictors of dietary practices in young women. Pub. Health Nutr.2: 513-519.
- 34.M E Dinehart, J E Hayes, L M Bartoshuk, Lanier S L, Duffy V B. (2006) Bitter taste markers explain variability in vegetable sweetness, bitterness, and intake. , Physiol. Behav 87, 304-313.
- 35.Keller K L, Steinmann L, Nurse R J, Tepper B J. (2002) Genetic taste sensitivity to 6-n-propylthiouracil influences food preference and reported intake in preschool children. , Appetite 38, 3-12.
- 36.Turnbull B, Matisoo-Smith E. (2002) Taste sensitivity to 6-n-propylthiouracil predicts acceptance of bitter-tasting spinach in 3–6-y-old children. , Am. J.Clin. Nutr 76, 1101-1105.
- 37.Bell K I, Tepper B J. (2006) Short-term vegetable intake by young children classified by 6-npropylthoiuracil bitter-taste phenotype. , Am. J. Clin.Nutr 84, 245-251.
- 38.Drewnowski A, Henderson S A, Cockroft J E. (2007) Genetic sensitivity to 6-n-propylthiouracil has no influence on dietary patterns, body mass indexes , or plasma lipid profiles of women. , J. Am. Diet. Assoc.107: 1340-1348.
- 39.A N Pronin, Xu H, Tang H, Zang L, Li Q. (2007) Specific alleles of bitter receptor genes influence human sensitivity to the bitterness of aloin and saccharin. , Curr. Biol 17, 1403-1408.
- 40.J C Wang, A L Hinrichs, Bertelsen S, Stock H, Budde J P. (2007) Functional variants in TAS2R38 and TAS2R16 influence alcohol consumption in high-risk families of African-American origin. , Alcohol Clin. Exp. Res 31, 209-215.
- 41.Stewart J E, Newman L P, Keast R S.(2011).Oral sensitivity to oleic acid is associated with fat intake and body mass index. , Clin Nutr 30, 838-44.
- 42.Keller K L, Liang L C, Sakimura J, May D, C van Belle. (2012) Common Variants in the CD36 Gene Are Associated With Oral Fat Perception, Fat Preferences, and Obesity in African Americans. , Obesity 20, 1066-1073.
- 43.Martínez-Ruiz N R, López-Díaz J A, Wall-Medrano A, Jiménez-Castro J A, Angulo O. (2014) Oral fat perception is related with body mass index, preference and consumption of high-fat foods. , Physiol Behav 129, 36-42.
- 44.Hayes J E, Bartoshuk L M, Kidd J R, Duffy V B. (2008) . Supertasting and PROP bitterness depends on more than the TAS2R38 gene. Chem Senses.33: 255-65.
- 45.Lim J, Urban L, Green B G. (2008) Measures of individual differences in taste and creaminess perception. , Chem. Senses 33, 493-501.
- 46.Pickering G J. (2008) Thermal taste, PROP responsiveness, and perception of oral sensations. , Physiol. Behav 95, 581-590.
- 48.Baranowski T, Baranowski J C, Watson K B, Jago R.Islam N et al.(2011). 6-n-propylthiouracil taster status not related to reported cruciferous vegetable intake among ethnically diverse children. , Nutr Res 31, 594-600.
- 49.Meyerhof W, Batram C, Kuhn C, Brockhoff A, Chudoba E. (2010) The molecular receptive ranges of human TAS2R bitter taste receptors. Chem Senses. 35, 157-70.
- 50.Tepper B J. (2008) Nutritional implications of genetic taste variation: the role of PROP sensitivity and other taste phenotypes. Annu Rev Nutr.28:. 367-88.
Cited by (15)
This article has been cited by 15 scholarly works according to:
Citing Articles:
E. Cantone, A. Tosco, A. Sepe, Valeria Raia, Rossella Negri et al. - Heliyon (2025) Semantic Scholar
Food Research International (2025) Crossref
N. Gotow, Yuko Nagai, Taro Taguchi, Yuko Kino, Hiroyuki Ogino et al. - Food Research International (2025) Semantic Scholar
Food Research International (2025) OpenAlex
Dorota Łukasiewicz-Śmietańska, Dariusz Godlewski, Elżbieta Nowakowska, Andrzej Szpak, Elżbieta Chabros et al. - PLoS ONE (2024) Semantic Scholar
PLoS ONE (2024) OpenAlex
PLOS ONE (2024) Crossref
Nutrients (2023) Crossref
Kyoko Aoki, Kanetaka Mori, Shohei Iijima, M. Sakon, Nariaki Matsuura et al. - Nutrients (2023) Semantic Scholar
Nutrients (2023) OpenAlex
M. Taha, C. J. Shortess, M. Noonan, C. Harrod, Mary J R Barham et al. - Journal of Otolaryngology and Rhinology (2021) Semantic Scholar
Journal of Otolaryngology and Rhinology (2021) OpenAlex
The Laryngoscope (2018) OpenAlex
The Laryngoscope (2018) Crossref
E. Cantone, Rossella Negri, E. Roscetto, Rossella Grassia, M. Catania et al. - The Laryngoscope (2018) Semantic Scholar
M. P. Riccio, Chiara Franco, Rossella Negri, R. I. Ferrentino, Roberta Maresca et al. - Autism Research (2018) Semantic Scholar
International Journal Of Nutrition (2015) OpenAlex