
Effect of a High Fat and High Protein Diet on Exercise-Induced Skeletal Muscle Hypertrophy in Rats
Abstract
The skeletal muscle mass varies by race. Dietary habits over generations are a factor that influences the skeletal muscle mass, as well as genetic factors. Therefore, we investigated the effects of diets with different macronutrient contents on exercise-induced muscle hypertrophy in rats. Male 4-week-old Sprague–Dawley rats were randomly divided into three groups: a normal-diet (N), high-protein diet (HP) and high-fat diet (HF) group. The food intake was manipulated to gain comparable body weight across the three groups. All rats were performed a climbing exercise training for 8 weeks. The final body weight and weight of the liver, kidneys and adipose tissues did not significantly differ among the groups. The flexor hallucis longus was significantly higher in the HF group than in the HP group. The total lipid content in the muscle was significantly higher in the HF group than in the N group, while it did not differ significantly between the HF and HP groups. There were no marked differences in the water or protein content in the muscle among the groups. The plasma amino acid concentration was significantly or tended to be lower in the HP group than in the HF or N group, except for the branched-chain amino acid concentration, which tended to be higher after ingesting the HP diet than other diets. These findings suggest that consuming an HP diet is not likely to facilitate exercise-induced muscle hypertrophy, partly due to the plasma amino acid imbalance induced by habitual HP diet consumption.
Author Contributions
Academic Editor: Jaime Hinzpeter, Medical Doctor, University of Chile, Santiago, Chile.
Checked for plagiarism: Yes
Review by: Single-blind
Copyright © 2019 Takako Fujii, et el.
 This is an open-access article distributed under the terms of the Creative Commons Attribution License, which permits unrestricted use, distribution, and reproduction in any medium, provided the original author and source are credited.
Competing interests
The authors have declared that no competing interest exists.
Citation:
Introduction
Body composition reportedly varies by race, with Westerners being said to have more skeletal muscle mass than people of Asian descent 1, 2, 3. Genetic factors are likely primarily attributable to such variations, but dietary habits over the generations are also factors that influence the skeletal muscle mass. The Western diet is regarded as being high in protein and fat compared with the Asian diet. However, the protein-to-energy ratio does not differ significantly between the Western diet (12.2% in the US and 12.9% in France) and the Asian diet (11.1% in China and 13.1% in Japan), although the fat-to-energy ratio is higher in the Western diet (37.2% in the US and 41.8% in France) than in the Asian diet (29.5% in China and 28.8% in Japan) 4. Therefore, the greater skeletal muscle mass in Westerners may be associated with the higher fat ratio in their diet.
Studies examining the effect of nutrition on muscle protein synthesis have focused on aspects such as the type 5 and ingested amount 6 of protein, as well as the effects of protein and carbohydrate combination 7. However, few studies have evaluated the effect of a high-fat diet on body protein synthesis. Skeletal muscle protein synthesis has been shown to be higher when post-exercise nutrition was provided soon after exercise compared with later 8, 9, 10.
Therefore, in the present study, we investigated the effects of different diets including a standard diet (AIN-93G), a high-fat diet and a high-protein diet being consumed soon after exercise on exercise-induced muscle hypertrophy in rats.
Materials and Methods
Animals and Experimental Design
Sixty-three male Sprague-Dawley rats (4-weeks old, Japan CLEA, Osaka, Japan) were randomly divided into 3 groups: a normal diet (AIN-93G) (N, n = 21), high-protein diet (HP, n = 21) and high-fat diet (HF, n = 21) group. All animals were individually housed in an animal room at 23 ± 1 °C with lights on from 08:00 to 20:00. Meals were provided at 08:00 to 09:00 and 20:00 to 21:00 for 8 weeks. Since the energy intake varied among the groups, being higher in the HF and lower in the HP groups, the food intake was manipulated to gain comparable body weight across the three groups and eliminate the influence of the body weight itself on the muscle mass. Drinking water was available at all times. The body weight of the rats and their food intake were measured everyday throughout the experiments.
The protocol of this study was approved by the Experimental Animal Care Committee of Osaka University of Health and Sport Sciences.
Diet Composition
The diet compositions are shown in Table 1. The N was a standard diet for rodents (AIN-93G). The protein-to-energy ratio of the HP was 35%, which is the upper limit of acceptable macronutrient distribution ranges (AMDRs) in humans 11, 12. The fat-to-energy ratio of the HF was 40%, which has been reported to increase the abdominal adipose mass compared to an N 13
Table 1. Compositon of experimental diet| Ingredient (g/kg) | |||
| N | HF | HP | |
| Corn starch | 397 | 297 | 290 |
| Milk casein | 200 | 237 | 379 |
| α ‐ Corn starch | 132 | 98 | 97 |
| Glucose | 100 | 77 | 63 |
| Purified soybean oil | 70 | 190 | 70 |
| Cellulose | 50 | 50 | 50 |
| Mineral mixture | 35 | 35 | 35 |
| Vitamin mixture | 10 | 10 | 10 |
| Choline bitartrate | 3 | 3 | 3 |
| L-Cysteine | 3 | 3 | 3 |
| tert-Butylhydroguinone | 0.014 | 0.014 | 0.014 |
| Energy (kcal/kg) | 3740 | 4422 | 3771 |
| Energy rate (%) | |||
| Protein | 18.8 | 18.8 | 35.1 |
| Fat | 18.4 | 40.0 | 18.7 |
| Carbohydrate | 61.4 | 39.4 | 44.0 |
Exercise Training
The exercise protocol employed in the present study has been confirmed to result in long flexor hallucis longus (FHL) hypertrophy 14. In brief, about 10 rats were trained simultaneously in a wire mesh cage (length 29 × width 39 × height 100 cm) placed on an electric hot plate adjusted to 53 °C with an electrical transformer (SLIDAC SD 105; Toshiba, Tokyo, Japan). The rats moved around and crowded on the wall surface and were rarely positioned at the bottom of the climbing apparatus during the exercise. The temperature of 53 °C is the minimum temperature that can be used to provoke the rats to climb without a risk of inducing burn injury in the event that the rats descend onto the hot plate. The exercise regimen consisted of exercising 3 times a week (5 min × 6 sets/day) during the 8-week study. The rats were allowed to rest for 5 min between each set. This exercise regimen has been shown to induce no significant changes in the adrenal weight or decreases in the food intake or body weight gain in previous studies in our laboratory 14.
Dissection
Dissection was performed 8 weeks after starting the experiment. The rats were sacrificed pre-exercise (Pre-Ex), post-exercise (Post-Ex), after 30-min feeding with respective diet after exercise (Post-Ex-Fed) and after 30-min fasting after exercise (Post-Ex-Fast) (n = 5-6/group/sacrifice point) on the last day of the experiment. The rats were euthanized by drawing blood from the abdominal aorta under anesthesia. The liver, spleen, kidneys, heart, FHL, flexor muscles of the forearm and perirenal, posterior abdominal, mesenteric and genital adipose tissues were removed and weighed and stored at -30 °C until analyses.
Specimens of the FHL of one leg were quickly removed, weighed and stored at -80 °C until Western blot analyses of eukaryotic initiation factors (p70 S6K, p-eEF2). The blood samples were centrifuged, and the obtained plasma was stored at -30 °C until analyses.
Analyses
Biochemical Analyses
The plasma urea nitrogen concentration was measured by urease-indophenol method (Urea nitrogen B-test Wako; Wako Pure Chemical Industries, Osaka, Japan). The plasma glucose concentration was measured using the Murotaze-GOD method (Glucose CII-test Wako; Wako Pure Chemical Industries). The plasma insulin concentration was measured using a sandwich enzyme-linked immunosorbent assay (Mercodia Rat insulin ELISA Kit; Mercodia, Uppsala, Sweden). The plasma amino acid concentration assay was outsourced and was analyzed with an amino acid analyzer (Mitsubishi Chemical Medience, Tokyo, Japan).
The flexor muscles of the forearms obtained from the rats in the pre-exercise groups were freeze-dried, and the water content was obtained as the difference in the weight between before and after drying. The protein amount in the muscle was measured with the Kjeldahl method, and the total lipid content was measured with the Folch method.
Western Blot Analyses were performed as previously reported 15. Tissues were homogenized in RIPA Lysis Buffer (Santa Cruz Biotechnology, Santa Cruz, CA, USA), and then protein concentration was quantified using BCA Protein assay reagent (Pierce Biotechnology, Rockford, IL, USA). Equal amounts of total cellular protein were applied to sodium dodecyl sulfate polyacrylamide gel electrophoresis (SDS-PAGE). The size-fractionated proteins were transferred to a polyvinylidene difluoride (PVDF) membrane. After transfer, the membranes were blocked with 5% bovine serum albumin (BSA) in Tris-buffered saline (pH 7.4) containing 0.05% (v/v) Tween-20 (TBST). The membranes were then incubated overnight at 4 °C with primary antibodies diluted in 5% BSA/TBST. The primary antibodies used in this study were Phospho-p70 S6 Kinase (Thr389) and Phospho-eEF2 (Thr56). All antibodies were obtained from Cell Signaling Technology Japan (Tokyo, Japan). The membranes were washed in TBST and then incubated with Anti-rabbit IgG, HRP-linked Antibody in 5% BSA/TBST for 1 h at room temperature. The membrane was washed again in TBST, and signals were visualized by ECL-prime detection reagent (GE Healthcare UK, Ltd., Buckinghamshire, UK) using an ECL mini camera (GE Healthcare UK, Ltd). The band intensity was quantified using the Image J software program (National Institutes of Health, Bethesda, MD, USA).
Statistical Analyses
Data obtained Pre-Ex, Post-Ex, Post-Ex-Fed and Post-Ex-Fast were analyzed with a one-way analysis of variance at each time point. When significane was observed, the Tukey-Kramer test was employed. The expression of p70 S6K and p-eEF2 between Pre-Ex and Post-Ex was compared with a t-test, and their expression Post-Ex, Post-Ex-Fed and Post-Ex-Fast were analyzed with a one-way analysis of variance and the Tukey-Kramer test. P values of less than 5% were regarded as statistically significant. Only the data of the Pre-Ex groups were used for the final body weight, food intake, organ and tissue weights and the composition of flexor muscles of forearms in order to eliminate acute effect of the last exercise bout and feeding or fasting after the last exercise.
Results
The final body weight and total food intake during the experiment did not differ significantly among the three groups (Table 2).
Table 2. Final body weight and total food intake during the study| N | HF | HP | ||
| Body weight | g | 379.5 ± 14.1 | 385.5 ± 8.3 | 379.8 ± 15.2 |
| Food intake | Kcal/ 8 weeks | 3810.6 ± 172.2 | 3831.9 ± 209.1 | 3873.5 ± 181.7 |
The organ and tissue weight values are shown in Table 3. The FHL weight was significantly higher in the HF group than in the HP group, and the FHL weight in the N group did not differ significantly from that in the HF and HP groups. The weights of liver, kidneys, all adipose tissues collected and flexor muscles of the forearm did not differ significantly among the groups.
Table 3. Organ and tissue weights| N | HF | HP | |||
| Organ | Liver | g | 12.39 ± 1.08 | 11.78 ± 0.76 | 12.58 ± 0.71 |
| Kidneys | g | 2.32 ± 0.12 | 2.34 ± 0.17 | 2.54 ± 0.16 | |
| Adipose tissue | Perienal | g | 1.18 ± 0.2 | 1.36 ± 0.47 | 1.65 ± 0.35 |
| Epididymal | g | 4.13 ± 0.74 | 3.95 ± 1.49 | 5.38 ± 0.68 | |
| Posterior abdominal | g | 3.56 ± 0.45 | 4.00 ± 1.11 | 4.67 ± 0.86 | |
| Mesenteric | g | 5.88 ± 0.65 | 5.68 ± 1.36 | 6.25 ± 0.56 | |
| Total | g | 14.75 ± 1.62 | 14.99 ± 3.61 | 17.96 ± 1.89 | |
| Muscle | FHL | g | 1.25 ± 0.08ab | 1.33 ± 0.05a | 1.18 ± 0.08b |
| Flexor muscles of forearm | g | 2.03 ± 0.07 | 2.09 ± 0.09 | 1.96 ± 0.14 | |
The water and protein content in the flexor muscles of the forearm did not differ significantly among the groups, although the total lipid content was significantly higher in the HF group than in the N group, while the total lipid content was not significantly different between the HP and N groups and between the HF and HP groups (Figure 1).
Figure 1.The water, protein and total lipid in the forearm flexors. The values are presented as the means ± SD. The values that do not share a common superscript differ significantly (P < 0.05).
The results of blood and plasma analyses are shown Table 4. The plasma glucose and insulin concentration did not differ significantly among the groups (Table 4). The plasma urea nitrogen concentration was significantly higher in the HP group than in the N or HF group at all points.
Table 4. Plasma parameters| N | HF | HP | ||
| Glucose(mg/dl) | Pre-Ex | 221.1 ± 29.8 | 193.7 ± 26.7 | 213.0 ± 21.0 |
| Post-Ex | 186.9 ± 23.5 | 182.4 ± 13.3 | 194.1 ± 24.9 | |
| Post-Ex meal | 181.4 ± 9.1 | 167.4 ± 23.7 | 186.0 ± 17.1 | |
| Urea nitrogen(mg/dl) | Pre-Ex | 15.1 ± 2.8b | 14.8 ± 1.5b | 28.8 ± 2.1a |
| Post-Ex | 17.9 ± 3.3b | 19.7 ± 3.4b | 26.7 ± 3.4a | |
| Post-Ex meal | 21.5 ± 2.3b | 20.9 ± 2.5b | 35.4 ± 4.1a | |
| Insulin(μg/L) | Pre-Ex | 2.49 ± 2.36 | 1.07 ± 0.62 | 1.57 ± 1.54 |
| Post-Ex | 1.04 ± 0.83 | 0.83 ± 0.37 | 1.00 ± 1.53 | |
| Post-Ex meal | 1.31 ± 0.91 | 0.68 ± 0.38 | 1.22 ± 0.39 |
The plasma amino acid concentrations are shown in Figure 2a-d. Pre-Ex, non-essential amino acid (NEAA) and total amino acid (TAA) concentrations were significantly lower in the HP group than in the HF and N groups, while branched-chain amino acid (BCAA), essential amino acid (EAA) and EAA without BCAA (EAA w/o BCAA) concentrations were not significantly different among the groups. Post-Ex, EAA w/o AA, NEAA and TAA concentrations were significantly lower in the HP group than in the N and HF groups, whereas BCAA and EAA concentrations were not significantly different among the groups. At 30 minutes after consuming the respective diets (Post-Ex-Fed), the BCAA and leucine (data not shown) concentrations were significantly higher in the HP group than in the other two groups, while the EAA w/o BCAA, EAA, NEAA and TAA concentrations were not significantly different among the groups. At 30 minutes after exercising while fasting (Post-Ex-Fast), the EAA w/o BCAA, EAA, NEAA, TAA concentrations were significantly higher in the HF group than in the N and HP groups, while the BCAA concentration did not differ significantly among the groups (Figure 2d).
Figure 2.Plasma amino acid values. The values are presented as the means ± SD. The values that do not share a common superscript differ significantly (P < 0.05).
The effects of a single bout of exercise on the p-p70 S6K and p-eEF2 expression are shown in Figure 3. The p-p70 S6K expression was significantly higher Post-Ex than Pre-Ex in all groups without marked differences (Figure 3a). The p-p70 S6K expression did not differ significantly among the groups both Pre-Ex and Post-Ex. The p-eEF2 expression did not change significantly after exercise in any groups and did not differ significantly among the groups at Pre-Ex or Post-Ex (Figure 3b).
Figure 3.The expression of p-p70 S6K (a) and p-eEF2 (b) before and after exercise. The values are presented as the means ± SD. * p < 0.05 vs. Pre-Ex.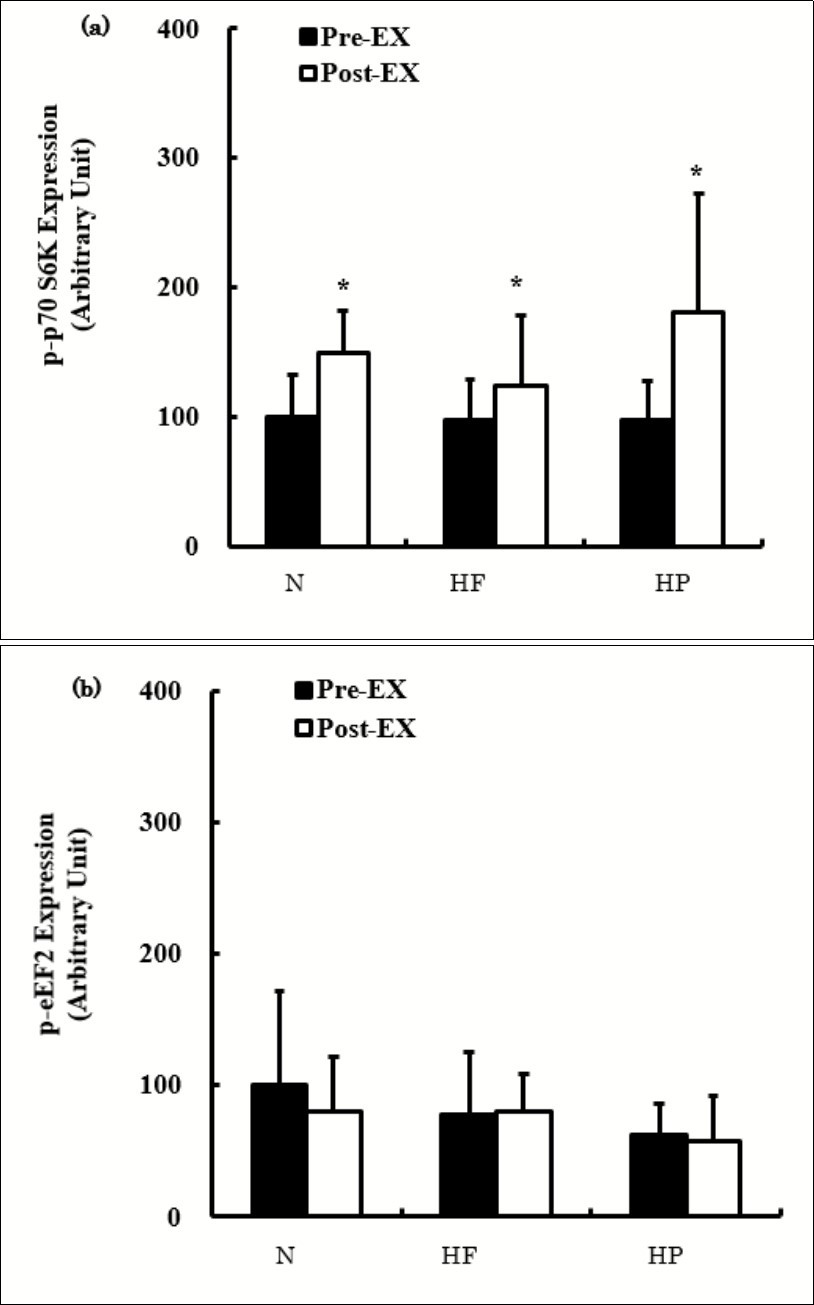
The effects of consuming each meal or fasting after exercise on the p-p70 S6K and p-eEF2 expression are shown in Figure 4. The p-p70 S6K expression was significantly increased at both Post-Ex-Fed and Post-Ex-Fast compared to Post-Ex in all groups, while the expression did not differ significantly between Post-Ex-Fed and Post-Ex-Fast. No marked differences were observed in the p-p70 S6K expression among the diet groups at any time points (Figure 4a). The p-eEF2 expression was not significantly different Post-Ex-Fed or Post-Ex-Fast compared with Pre-Ex (Figure 4b). The expression was not significantly different among the groups at any time points (Figure 4b).
Figure 4.The effects of consuming each meal or fasting after exercise on the p-p70 S6K (a) and p-eEF2 (b) expression. The values are presented as the means ± SD. * p < 0.05 vs. Post-Ex.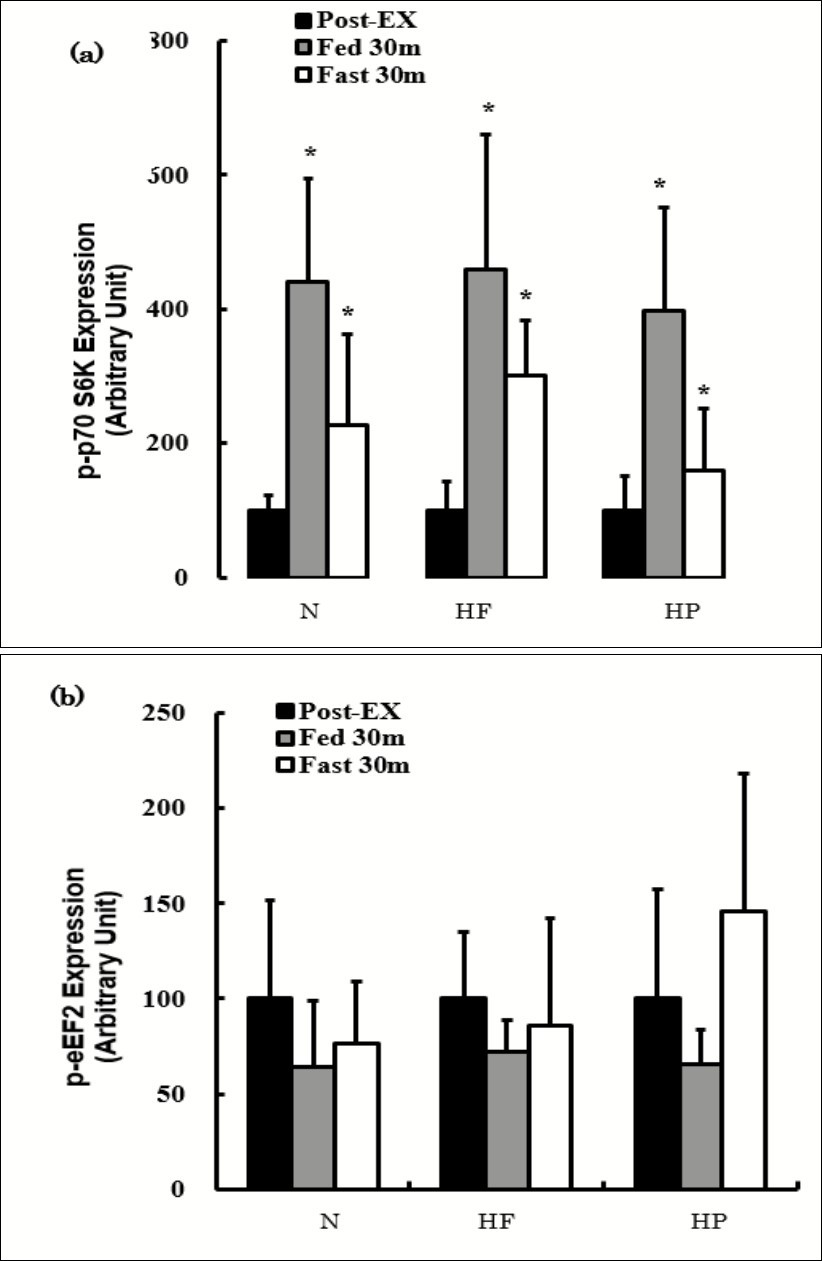
Discussion
We examined the effect of consuming different diets on exercise-induced muscle hypertrophy in rats and found that, after eight weeks of exercise training, the muscle mass was significantly higher in the HF group than in the HP group, whereas the mass in the HP and HF groups did not differ significantly from that in the N group. The higher mass in the HF group may be due to the total lipid content being greater in this group than in the HP group. However, the total lipid content in the HF group was comparable to that in the HP group. Therefore, the HP diet does not appear to facilitate exercise-induced muscle hypertrophy compared to the other two diets. This is consistent with the findings of our previous study, showing that the HP diet did not increase muscle mass 16.
The phosphorylation of p70 S6K increased significantly after exercise compared to before exercise (Figure 1a). In the present study, the expression of phosphorylated p70 S6K was higher 30 minutes after exercise under both fed and fasted conditions (Figure 2a). The expression tended to be higher in the fed state than in the fasted state, although the expression was not significantly different. These results suggest that the protein synthesis was activated by exercise in this study. However, there were no significant differences in the expression among the diet groups (Figure 1a). In addition, phosphorylation of eEF2 showed neither an exercise effect nor a post-exercise nutrition status effect (fed or fasted) (Figure 1b and Figure 2b). Thus, the expression of these proteins cannot be responsible for the FHL weight being significantly greater in the HF group than in the HP group.
In the current study, habitual HP consumption reduced the basal (Pre-Ex) plasma concentration of total and non-essential amino acids. Masanes et al. 17 reported that the protein content in the striated muscle was lower in rats consuming a high-protein diet (protein energy 36%) than in those consuming a normal-protein diet (protein energy 20%). Chevalier et al. 18 found that the fractional synthesis rate (FSR) in the skeletal muscle was not significantly different between rats given a standard protein diet (protein energy 13%) and those given a high-protein diet (protein energy 48%) for 14 days. They reported that the skeletal muscle weight was not significantly different between the groups. Bolster et al. 19 showed that, in endurance athletes, changing diets from a low-protein diet (0.8 g/kg BW/day) to a normal-protein diet (1.8 g/kg BW/day) did not promote FSR in the muscle after exercise, whereas increasing the protein intake to 3.6 g/kg BW/day significantly decreased the FSR. In the present study, a standard diet for rodents (AIN-93G), which contains a sufficient amount of protein, was provided as the normal diet. The HP given in the present study contained about twice the amount of protein as the N. Therefore, the amount of protein that the rats in the HP group consumed was greater than that regarded as sufficient for muscle protein synthesis. While the FSR in the skeletal muscle was not measured in the present study, it is possible that the FSR in the skeletal muscle was lower in the HP group than in the HF or N groups. In addition, Mitchell et al. 20 stated that the increase in FSR does not match the change in muscle mass.
An increase in the plasma amino acid concentration is a factor that stimulates the muscle protein synthesis rate. Tang et al. 21 reported that an increase in essential amino acids or leucine in the circulation was a factor necessary for enhancing muscle protein synthesis after eating at rest and/or exercise. In the present study, the plasma leucine, BCAA and EAA concentrations pre- and post-exercise were not significantly different among the groups. However, the plasma leucine and BCAA concentrations were significantly higher in the HP group than in the N and HF groups following a post-exercise meal. BCAAs are not metabolized in the liver but instead released into the blood 11. Therefore, BCAA and leucine concentrations increased in the HP group in the present study. These results suggest that the increase in plasma leucine levels after exercise was not associated with exercise-induced muscle hypertrophy. In contrast, the plasma NEAA and TAA concentrations pre- and post-exercise were significantly lower in the HP group than in the N and HF groups. Habitual high-protein diet ingestion appears to increase the plasma BCAA and leucine concentrations and decrease the EAA, NEAA and TAA concentrations. NEAA is required for protein synthesis. Therefore, the plasma amino acid balance would not be suitable for skeletal muscle protein synthesis in the HP group. In contrast, the plasma amino acid concentrations in the HF group were comparable to or higher (Post-Ex-Fast) than those in the N group and significantly higher than those in the HP group at some time points, possibly due to the greater mass of FHL in the HF group.
The upper limit of the amount of protein available for muscle protein synthesis is considered to be around 2.0 g/kg BW/day in humans 12, and excessively ingested protein is not used for protein synthesis, instead being primarily oxidized. Price et al. 22 reported that both postprandial body protein synthesis and post-absorptive body protein breakdown increased as the habitual protein intake increased. Juillet et al. 23 showed that increasing the habitual protein intake reduced the postprandial retention of protein nitrogen, mainly by diminishing the efficiency of its peripheral availability and anabolic use. Morens et al. 24 reported that there was no significant difference in the skeletal muscle weight when an HP (50% of energy) was given to rats for 15 days compared with the outcomes of administering an N (14% of energy). Thus, consuming an HP is not likely to facilitate exercise-induced muscle hypertrophy.
Conclusion
Consuming a high-protein diet is not likely to facilitate exercise-induced skeletal muscle hypertrophy compared to N or HF, possibly due to an imbalance in the plasma amino acid concentrations. The higher plasma amino acid levels in the HF group than in the HP group might be associated with a greater increase in the skeletal muscle mass in exercise-trained rats.
References
- 1.Wulan S N, Westerterp K R, Plasqui G. (2012) Dietary and24-h fat oxidation in Asians and whites who differ in body composition. , Am J Clin Nutr 95, 1335-1341.
- 2.Ishida Y. (1994) Changes in body composition with aging by B-mode ultrasound measurement - A comparison of Japanese and Caucasian male. , Minzokueisei 60, 212-222.
- 3.Song M Y, Kim J, Horlick M, Wang J, Pierson RN Jr et al. (2002) Prepubertal asians have less limb skeletal muscle. , J Apple Physiol 92, 2285-2291.
- 4. (2001) Food balance sheets a handbook. , FOOD AND AGRICULTURE ORGANIZATION OF THE UNITED NATIONS. Rome
- 5.Tarnopolsky M A, Atkinson S A, MacDougall J D, Chesley A, Phillips S et al. (1992) Evaluation of protein requirements for trained strength athletes. , J Appl Physiol 73, 1986-1995.
- 6.Durmin J V, Garlick P, Jackson A A, Schurch B, Shetty P S et al. (1999) Report of the IDECG Working Group on lower limits of energy and protein and upper limits of protein intakes. , Eur J Clin Nutr. 53 Suppl 1, 174-176.
- 7.Staples A W, Bird N A, West D W, Cary K D, Atherton P J et al. (2001) Carbohydrate does not augment exercise-induced protein accretion versus protein alone. Med and Sci Sports Exerc. 43, 1154-1161.
- 8.Esmarck B, Andersen J L, Olsen S, Richter E A, Mizuno M et al. (2001) Timing of postexercise protein intake is important for muscle hypertrophy with resistance training in elderly humans. , J Physiol 535, 301-311.
- 9.Okamura K, Doi T, Hamada K, Sakurai M, Matsumoto K et al. (1997) Effect of amino acid and glucose administration during postexercise recovery on protein kinetics in dogs. , Am J Physiol 272, 1023-1030.
- 10.Levenhagen D K, Gresham J D, Carlson M G, Maron D J, Borel M J et al. (2001) Postexercise nutrient intake timing in humans in critical to recovery of leg glucose and protein homeostasis. , Am J Physiol Endocrinol Metab 280, 982-933.
- 11.Phillips S M. (2006) Dietary protein for athletes: from requirements to metabolic advantage. , Appl Physiol Nutr Metab 31, 647-654.
- 12.Phillips S M, Moore D R, Tang J E. (2007) A critical examination of dietary protein re quirements, benefits, and excesses in athletes. , Int J Sport Nutr Exerc Metab 17, 58-76.
- 13.Higashida K, Sonou T, Fujimoto E, Higuchi M. (2015) Effects of difference of dietary fat contents on muscle mitochondrial enzyme activities and endurance exercise performance in rats. , Sports SR 12, 137-144.
- 14.Fujii T, Asai T, Matsuo T, Okamura K. (2011) Effect of resistance exercise on iron status in moderately iron-deficient rats. Biol Trace Elem Res. 144, 983-991.
- 15.Nakai N, Kawano F, Nakata K. (2015) Mechanical stretch activates mammalian target of rapamycin and AMP-activated protein kinase pathways in skeletal muscle cells. , Mol Cell Biochem 406, 285-292.
- 16.Fujii T, Matsuo T, Okamura K. (2011) Effect of a high protein diet on the anemia mitigating effect of resistance exercise in rats. , Nutritional Segment 2, 1561.
- 17.Masanes R, Fernandez-Lope J A, Alemany A, Romesar X, Rafecas I. (1999) Effect of dietary protein content on tissue protein synthesis rates in Zucker lean rats. , Nutri Res 19, 1017-1029.
- 18.Chevalier L, Bos C, Gryson C, Luengo C, Walrand S et al. (2009) High-protein diets differentially modulate protein content and protein synthesis in visceral and peripheral tissues in rats. , Nutrition 25, 932-939.
- 19.Bolster D R, Pikosky M A, Gaine P C, Martin W, Wolfe R R et al. (2005) Dietary protein intake impacts human skeletal muscle protein fractional synthetic rates after endurance exercise. , Rodriguez NR, Am J Physiol Endocrinol Metab 289, 678-683.
- 20.Mitchell C J, Churchyard-Venne T A, Cameron-Smith D, Phillips S M. (2014) What is the relationship between the acute muscle protein synthesis response and changes in muscle mass?. , J Appl Physiol 118, 495-497.
- 21.Tang J E, Moore D R, Kujbida G W, Tarnopolsky M A, Phillips S M. (2009) Ingestion of whey hydrolysate, casein, or soy protein isolate: effects on mixed muscle protein synthesis at rest and following resistance exercise in young men. , J Appl Physiol 107, 987-992.
- 22.Price G M, Halliday D, Pacy P J, Quevedo M R, Millward D J. (1994) Nitrogen homeostasis in man: influence of protein intake on the amplitude of diurnal cycling of body nitrogen. , Clinical Science 86, 91-102.