
Developing Cellular & Molecular Biomarkers for Anti-Inflammatory Activities of Probiotic Bacteria in Fermented Foods
Abstract
We present below a mechanistic cellular and molecular approaches for the development of Anti-Inflammatory biomarkersof Probiotic Bacteria in Fermented Foods. Probiotics are live microorganisms that promote human health by counteracting the noxious toxic gut microflora in human intestine, by modulating of the tight junctions, and by increasing mucin production, enforcing intestinal epithelial cell barrier function, modifying microbial community within the gut intestinal disorders, and improving immune responses associated with chronic inflammation in experimental animal models, collectively enhancing human health. Cytokine secretion by intestinal epithelial cells and macrophages are regulated by probiotics through key signaling pathways such as nuclear factor-κB and mitogen-activated kinases, resulting in alleviation of several disorders such as allergies, diabetes, obesity, heart diseases and cancer. MicroRNAs are small non-coding RNA molecules involved in transcriptional and post-translational regulation of gene expression by inhibiting gene translation. Using in vitro and in vivo approaches in cell lines and mice models to study effects of probiotic conditional media and heat-killed bacterial strains with anti-inflammatory effect to elucidate the mechanisms by which probiotics affect signaling pathways, and by using global cytokine and microRNA gene expression analyses approaches to develop biomarkers for studying different pro- and anti-inflammatory activities, and using statistical approaches to analyse the data, we show that cytokines and miRNAs have an essential role in regulation of cancerous and inflammatory pathways. This mechanistic approach will result in developing specific disease biomarkers for the early diagnosis of certain pathogenic states, as well as evaluating the effect of different dietary components on developed biomarkers in health states that will promote and enhance human health. Comparing the concordance of the in vitro to the in vivo research findings will confirm the correspondence of both approaches to each other. Moreover, this study will have a major public health relevance in elucidating the role of miRNAs and their targets in inflammation, paving the way to diagnosing and treating of pathogenic human disease stages.
Author Contributions
Academic Editor: Jie Yin, Institute of Subtropical Agriculture & University of Chinese Academy of Sciences, China.
Checked for plagiarism: Yes
Review by: Single-blind
Copyright © 2019 Farid E. Ahmed, et al.
 This is an open-access article distributed under the terms of the Creative Commons Attribution License, which permits unrestricted use, distribution, and reproduction in any medium, provided the original author and source are credited.
Competing interests
The authors have declared that no competing interests exist.
Citation:
Introduction
Probiotic bacteria represent specific bacterial species that are a common part of human microbiota. It is widely known that the interaction between the normal gut microflora and the human mucosa is an essential phenomenon for proper intestinal function. Nutrigenomic studies have shown that gut micrflora influence the efficiency of energy extracted from diet and fat storage to the degree that microflora have essential therapeutic relevance, and could counter a disease such as obesity 1. The microflora also influences the development and functioning of the immune system 2. Probiotic lactobacilli when administered in adequate amounts (108 to > 109) have been shown to induced health benefits such as reduction in intestinal infection, decreased allergies, alleviation of atopic eczema 3 as well as relief from inflammatory bowel disease (IBD) 4, although placebo-controlled cross-over studies have shown variable success rates 5, 6. In the mucosa of the proximal small intestine of healthy volunteers, three probiotic strains from the commonly-sold species (Lactobacillus acidophilus, L. casei and L. rahmnosus), each induced differential gene-regulatory networks and pathways, such as the nuclear factor-κB (NF-κB) in the human mucosa, which regulates major basal mucosal processes such as: immune response, hormonal regulation of tissue growth and development, ion homeostasis, hormonal regulation of blood pressure, wound healing, ion homeostasis, and to also produce similarities to response profiles of bioactive molecules and drugs such as Dibenzyline, Nadolol, Proscillaridin, Cephaeline, Helveticoside and Emetine, among others 7. A large person-to-person variation in response transcriptomes, and the high variations for genes encoding bioactive molecules, including immune cell-attracting and cell–activating chemokines, could explain the variable response among individuals to probiotic supplementation 7. An in vitro assessment of 3 probiotic strains, Lactobacillus, Bifidobacterium and Propionibacterium, isolated from fermented foods will be used in this research to evaluate the anti-inflammatory effect of the conditional media (probiotics) and the heat killed bacteria (secreted probiotics factors) in a macrophage cell line that expresses inducible NO synthases for cytolytic and cytotoxic potential.
Cytokine secretion by intestinal epithelial cells (IEC) and macrophages is up or down regulated by probiotics through modulations of key signaling pathways such as NF-kB and mitogen-activated protein kinases (MAPKs) 8, 9, 10. An important factor that is affected by probiotics is the peroxisome proliferate-activated receptor gamma (PPARу) that is highly expressed in the colon, which exerts an anti-inflammatory role through the inhibition of NF-κB pathway. The probiotics strain L. case has been reported to suppress the expression of inflammatory mediators in intestinal epithelial cells, which is assumed to be related to PPARγ activation 11. Inflammatory cytokines in tissue and blood will be studied using ELISA and flow cytometry. The NF-κB pathway is studied in cell lines in culture by comparing the green fluorescent protein and luciferase activities in treated and untreated transfectants. Three different models of mice study will be employed. The number of mice for each model will be determined by power analysis. Ordinary mouse strain C57BL/6J will be employed in a 4 week study using a powerful model for colon carcinogenesis, pathogenesis and chemoprevention investigation where dextran sulfate sodium (DSS) is introduced to the mice in their drinking water to induce colitis. Out of the five tested groups, one group is a negative control (does not receive either DSS or probiotics), and the rest four groups will receive colitis. After sacrifice, proximal, middle and distal portion of the colon will be examined for inflammation severity and extent, as well as crypt damage and epithelial erosion. The colon will be divided into 3 segments: one for histopathological evaluation; the 2nd for cytokine measurement, and the 3rdfor miRNA determinations. Adipose tissue, liver, muscle and heart tissue will be harvested and divided to 3 parts: the first part will be homogenized, weighed, snap frozen and stored at -80°C until used to measure total lipids, total triglycerides and cholesterol. The other two parts of colon tissues will be used for cytokine measurements and miRNA analysis. The total amount of cholesterol, triglycerides, free fatty acids (FFA) will also be measured in the plasma samples. Moreover, total lipids will be measured in the dried mice feces for total fat excretion measurement. The same mouse strain C57BL/6J, but with deficiency in low density lipoprotein receptor (B6.129S7-Ldlrtm1Her/J), will be employed as a second model in a six week study to evaluate the prevention effect of probiotics on diet-induced fatty liver disease. Mice will be divided into five groups. A low fat negative control (LF-Con) group will be fed AIN-93M diet (containing 5.2% fat by weight); whereas four other groups will be fed high fat Western style diet (containing 21% by weight milk fat, 0.2% cholesterol). A third model, diet-Induced Obesity (DIO) C57BL/6J, will be employed in a six week study to test 3 diets: n-3 poly unsaturated fatty acids (PUFA), vitamin D, and selenium to evaluate the effect of above 3 diets on developed biomarkers in health states in which different tissues & blood samples will be collected over the course of study to monitor changes in miRNA expression.
The small non-coding miRNA molecules have been correlated with different inflammatory activities, but few miRNAs have been validated with regard to endothelial cell function regulation. We will study the role of these miRNAs for different anti inflammation activities, and will explore the mechanism by which probiotics affect the signaling pathways of NFκB (in response to different inducing agents such as TNF-a or LPS, MAPKs, and transcriptional regulators such as heat shock transcription factor 1 and PPARγ), using total RNA extracted from LCM colon tissue or from stool, perform RT reaction, then carry out oligonucleotide microarray studies, focused microarray expressions studies, followed by modified real-time TaqMan® quantitative RT-qPCR reactions to quantify miRNAs.
The Food and Agricultural Organization of the United Nations and the World Health Organization (FAO/WHO) considers probiotics as “Live microorganisms, which when administered in adequate amounts confer a health benefit on the host” 12. Lactobacilli and bifidobacteria are potential health-promoting probiotics and their fermentative metabolism counterbalances putrefaction caused by the noxious gut bacteria and their toxic effect on the human tissues 13. It was shown that Lactobacillus plantarum C88 isolated from traditional Chinese fermented dairy tofu displays significant antioxidant activity in vitro and in vivo, and at a dose of 1010CFU ml-1, the lactobacilli inhibited 44 % of the free radical 1, 1-Diphenyl-2-picryl-hydrazyl (DPPH) scavenging activities 14. Moreover, many studies in mice and humans have already demonstrated how gut function may be modulated by a single probiotics strain, or combinations of strains 8.
We outline five objectives and detail methodologies for carrying out a nutrigenomic molecular research study. Time-line for achieving the outlined objectives is detailed in Table 1 below.
Table 1. Proposed timeline (in months) for accomplishing the above research objectives| Method-Aim/Months | Objective 1: Select three potent probiotic strains with anti-inflammatory effect of conditional media & heat killed probiotic strains isolated from fermented foods (Lactobacillus, Bifidobacterium, Propionibacterium) | Objective 2: Employ in vivo studies in mice models to elucidate the mechanism by which probiotics affect signaling pathways, and using gene expression analysis to develop miRNA biomarkers for different anti-inflammatory activities | Objective 3: Employ in vivo mouse model to evaluate the effect of different nutrients on developed biomarkers in health states | Objective 4: Study the role of statistics in realizing aims 1 through 3 | Objective 5: Provide & carry out alternate standardized methods to achieve study goals, if necessary |
| 1-4 | ☐☐☐☐☐☐☐☐☐☐a | ||||
| 5-8 | ☐☐☐☐☐☐☐☐☐☐ | ||||
| 9-12 | ☐☐☐☐☐☐☐☐ | ☐ | ☐ | ||
| 13-16 | ☐☐☐☐☐☐☐☐☐☐ | ||||
| 17-20 | ☐☐☐☐☐☐☐☐☐☐ | ☐ | |||
| 21-24 | ☐☐☐☐☐☐☐☐☐☐ | ||||
| 25-28 | ☐☐☐☐☐☐☐☐☐☐ | ||||
| 29-32 | ☐☐☐☐☐☐☐☐☐☐ | ||||
| 33-36 | ☐☐☐☐☐☐☐☐☐ | ☐ | |||
| 37-40 | ☐☐☐☐☐☐☐ | ☐ | |||
| 41-44 | ☐☐☐☐☐☐☐☐☐☐ | ||||
| 45-48 | ☐☐☐☐☐☐☐☐☐☐ | ||||
| 49-52 | ☐☐☐☐☐☐☐☐☐☐ | ||||
| 53-57 | ☐☐☐☐☐☐☐☐☐ | ☐ | ☐ | ||
| 57-60 | ☐ | ☐☐☐☐☐☐ | ☐☐☐ |
1. Select the three most potent probiotic strains having an anti-inflammatory activity by employing an in vitro assessment of the anti-inflammatory effect of the conditional media (probiotics) and the heat killed bacteria (secreted probiotics factors). Three probiotics strains isolated from fermented foods and belong to the genera (Lactobacillus, Bifidobacterium and Propionibacterium) will be selected.
2. Evaluate the selected probiotics by employing in vivo studies in mice models to elucidate the mechanism by which probiotics affect signaling pathways, and using gene expression analysis to develop microRNA biomarkers for the different anti-inflammatory activities.
3.Employ in vivo mouse model to evaluate the effect of three different nutrients and dietary components on developed biomarkers in health states.
4.Study the role of statistics in realizing aims 1 through 3.
5.Provide and carry out alternate standardized technical methods for achieving the above aims in the unlikely event that the proposed approach, or the outlined methods fail to achieve study goals.
Probiotics-Host Communication
Probiotics benefit the host through communicating with many types of cell. Contact between the host and intestinal microbes occur in the intestinal epithelial cells (IECs), where variety of complex interactions between probiotics bacteria and the different constituents of the intestinal ecosystem take place. Additionally, IECs act as the first line of defense against pathogenic bacteria. IECs extensively communicate with commensal microbes and probiotics, and they are also affected by probiotics in various ways, as by enhancing barrier function, inducing antimicrobial and heat shock protein production, which were shown to cause an increase in mucin production, interference with pathogenic organisms, as well as signaling pathways' modulation 8.
Probiotics modulations of tight junctions and enhanced mucin production are the most important factors that enhance the Intestinal epithelial cell (IEC) barrier function. By modifying the microbial community within the gut, intestinal disorders such as inflammatory bowel disease (IBD) could be prevented or treated. Moreover, immune responses associated with chronic inflammation were shown to be attenuated by gut microbial strains in experimental animal models 8.
Modulation of Inflammatory Signaling Pathways in IECs Affecting Cell Survival & Cytokine Secretion
Cytokine secretion by IECs and macrophages is regulated (up or down) by probiotics through key signaling pathways, such as the nuclear factor kappa-light-chain-enhancer of activated B cells (Nuclear Factor-κB, NFκB) and mitogen-activated protein kinases (MAPKs), which could alleviate or treat several disorders, such as allergies, diabetes, obesity and cancer 8.
The NF-κB pathway is a major signaling pathway for activation of immune responses, secondary to a range of stimuli. NF-κB has been extensively used as an intracellular signaling molecule for hormones, cytokines, chemokines, and growth factors 9. NF-κB pathway signifies a connection between probiotics and IECs. Under non-stimulatory conditions, non-activatedNFκB is present in its inactive form in the cytoplasm binding to inhibitory IκB proteins.NF-κB cannot enter the nucleus and activate transcription when it is bound to its IκB inhibitor molecule. Upon stimulation of the pathway by an activation factor, signaling pathways are triggered, resulting in activation of the IκB kinase (IKK), which in turn phosphorylates IκB proteins. Upon phosphorylation by IKK, IκB is targeted for degradation by an ubiquitin–proteasomal pathway, resulting in IkB dissociation from the NF-κB, and release ofNF-κB. Released NF-κB migrates into the nucleus, activates transcription of effector genes and binds target promoters. These stimuli include inflammatory cytokines, such as interleukin-1 (IL-1), or tumor necrosis factor alpha (TNF-α) 10.
Other probiotic strains can also avert degradation of IκB. Studies that explored the impacts of both variables and also heat-killed Lactobacillus rhamnosus GG in an epithelial cell model, showed the probiotic's ability to diminish IκB degradation and the consequent NFκB translocation into the nucleus, resulting in decreased TNF-induced IL-8 production 15. In another study, L. rhamnosus GG has been shown to prevent the adherence of Bacillus vulgatus to epithelial cells, preventing the recurrence of colitis after antibiotic treatment in transgenic rats, suggesting that antibiotics and probiotic agents provide synergistic therapeutic immunomodulation effects 16. An important factor that is affected by probiotics is the peroxisome proliferator-activated receptor gamma (PPARγ). PPARγ is a nuclear receptor that plays an anti-inflammatory role through the inhibition of nuclear factor-κB (NF-κB) pathway. PPARγ is highly expressed in the colon. The probiotic strain L. caseinhas been reported to suppress the expression of inflammatory mediators in intestinal epithelial cells, which is assumed to be related to Par activation 11. Other studies showed probiotics to have inhibitory effects on the NFκB pathway in IECs, but have been unsuccessful to describe how NFκB activation is prevented. Some probiotic bacteria could excite the NFκB pathway to cause increased cytokine secretion rather than the inactivation of the signaling pathway 17.
MicroRNAs (miRNAs) are a small non-coding RNA molecules 18, 19, 20, 21, 22, 23, 24 (inucleotide long), which are involved in transcriptional and post-transcriptional regulation of gene expression by inhibiting gene translation 18. MiRNAs silence gene expression through inhibiting mRNA translation to protein or by promoting the degradation of mRNA. Since first reported in the literature in 199319, the number of identified miRNAs in 2009 was more than 700 according to miRbase 13.0, March 2009, http://microrna.sanger.ac.uk/; in 2010 the number of identified miRNAs has been reported to be 500–1500 miRNAs per genome, in total, over 15000 microRNAloci, expressing more than 17000 different mature sequences from 142 species 20. Recently miRNA count is 24521 entries according to the last release of miRBase in June 2013 (http://www.mirbase.org/).MiRNAs are processedby RNA polymerase II to form a precursor step which is a long primary transcript. Pri-miR is converted to miRNA by sequential cutting with two enzymes belonging to a class of RNA III endonucleases, Drosha and Dicer. Drosha converts the a long primary transcripts to about ~70 nt long primary miRNAs (pri-miR) which are then exported to the cytoplasm by Exportin 5, converted to mature miRNA (~22 net) by Dicer 21. Each miRNA may control multiple genes, and one or more miRNAs regulate a large proportion of human protein-coding genes, whereas each single gene may be regulated by multiple miRNAs 22. MicroRNAs inhibit gene expression through interaction with 3-untranslated regions (3 UTRs) of target messenger RNAs (mRNAs) carrying complementary sequences 23. Recently, miRNAs have been reported to regulate both innate and adaptive immune responses in addition to inflammations in various cell and tissues.
Our recent study that investigating the effect of dietary intervention with probiotic foods on changes in the intestinal microflora among healthy Egyptians, twenty eight adolescent human males, who were randomly assigned to one of four groups consuming regular yogurt, synbiotic yogurt (combining probiotic & prebiotic: inulin), sobya (fermented rice), or unfermented rice milk placebo. The supplement was served daily for three weeks. Before starting and at the end of the intervention, the intestinal permeability was assessed by measuring the urinary lactose mannitol dual test (LMDT). Microbial examination, hydrolytic enzymes and short chain fatty acids (SCFA), mainly acetic, butyric and propionic acids, are the products of the bacterial fermentation of undigested carbohydrates, which were measured in feces. Urinary lactose/mannitol ratios were reduced only after dietary interventions with regular yogurt (P<0.05), or with combining data from symbiotic yogurt plus sobya (P<0.05). The fecal Lactocilli counts increased (p<0.05) in those receiving the fourth dietary treatments (P<0.05) compared to the preintervention levels. Similar trends were noticed for the bifido bacteria strains. On the other hand, enterobacteriaceae counts were reduced in the three groups consuming fermented supplements. Tendencies for increase in concentrations of fecal butyric, propionic and total SCAF were found among the groups consuming symbiotic yogurt or soybean compared to preintervention values. Intervention did not affect the activities of fecal hydrolytic enzymes (β-galactosidase, β-glucosidase and β-glucuronidase). Therefore, we concluded that consumption of fermented food supplements increased bifidobacteria and lactobacilli populations, and also decreased the pathogenic bacteria, which could be a potential health-promoting supplement for adolescents 24.
Innovation
The innovation of our multifaceted proposal lies in using in vitro and in vivo approaches in cell lines and mice, respectively, to study effect of probiotic conditional media & heat killed bacterial strains with anti-inflammatory effect to elucidate the mechanism by which probiotics affect signaling pathways, as well as use global cytokine and miRNA gene expression analyses approaches to develop biomarkers for the different pro- & anti-inflammatory activities. The novel contribution of this work is two folds: 1) Developing specific disease biomarkers that could be used for early diagnosis of certain pathogenic states. Moreover, revealing signaling pathway mechanisms may fill up the gap in our understanding of the initiation and development processes of related diseases, which could move the research from diagnosis to treatment state. 2) Evaluating the effect of different nutrients and dietary components on developed biomarkers in health states will promote health status, and prevent health problems. During the course of the experiments, combing in vivo and in vitro approaches will enable us to screen a large number of probiotic strains and their secreted factors in vitro. However, because in vitro results do not always coincide with in vivo data, this finding raise the importance of confirming the correspondence of the in vivo activity to the in vitro findings, in addition to complementing the in vitro results by using different mice models. Moreover, this study will be the first to screen for several cytokines along with a large number of miRNA gene expressions, which enables the application and validation of principal component analysis (PCA) statistical multivariate method, in which the patterns in the data could be predicted by similarities or differences of the tested components. Finally, although it has been shown that miRNAs have a prominent role in the regulation of cancerous and inflammation pathways, the literature is still in the early stage of elucidating the role of miRNAs and their respective targets in inflammation. The proposed study will pave the research to diagnosis, to reach the stage of treating the pathogenic states.
Materials and Methods
Select the three most potent probiotic strains having an anti-inflammatory activity by employing an in vitro assessment of the anti-inflammatory effect of the conditional media (probiotics) and the heat killed bacteria (secreted probiotics factors) of three different probiotic genera (Lactobacillus, Bifidobacterium and Propionibacterium) isolated from fermented foods.
Initially, the Selected Bacterial Strains are Assessed Individually in vitro for the Following Criteria:
1.The resistance to gastric acid to ensure that the administered probiotic bacteria survive transit to intestinal environment through the stomach, and that they are functioning effectively there 25.
2.The resistance to bile acids’ antibacterial effects 26.
3.The adherence (binding) to human gut epithelial tissues in order to colonize the gastrointestinal tract 26.
Subsequently, in vitro assessment to evaluate the anti-inflammatory effect of the conditional media (probiotics) and the heat killed bacteria (secreted probiotics factors) of each strain which passes the above mentioned criteria are employed as follow:
Effects in a Macrophage Cell Line
Macrophages activated with bacterial lipopolysaccharide (LPS) express inducible nitric oxide (NO) synthase (a short-lived radical that is produced by enzymatic oxidation of the amino acid L-arginine), and produce large amounts of NO, which has been reported to be an effector molecule for the cytostatic/cytotoxic properties of the activated macrophages 27.
The murine macrophage cell line J774.2 from mouse BALB/C monocyte macrophagewill be used (Sigma, St. Louis, MO). These cell lines will be grown and maintained in 100 mm plastic culture dishes containing Dulbecco's modified Eagle's medium (Gibco) (Sigma, St. Louis, MO) at 37°C in an atmosphere of air and5% CO2. Cells will be passaged every 3-6 days by diluting a suspension of the cells 1:10 in fresh medium to maintain the cultures between 3-9x10⁵cells/ml. These cells will be used to determine NO production. All selected probiotics strains will be assessed as previously described 28 in the presence or absence of LPS from E. coli serotype O55:B5.
Nitric Cxide Production Measurement
The production of nitric oxide is measured using Griess test where Nitrite is detected and analyzed by formation of a red pink color upon treatment of a NO2-containing sample with the Gris reagents previously described 28. Briefly, the murine macrophage J774 cells will be removed from culture dishes by pipetting vigorously. Cells will be precipitated by centrifugation followed by resuspension in the medium to a concentration of 1 x10⁶cells/ml. Cells are plated in 24 well culture plates and allowed to adhere for 2h. Cells are activated by LPS (0.1 µg/ml) after replacing the old with a fresh medium. They will then be incubated at 37°C for 72h in the presence or absence of probiotic strains. After appropriate incubation time, supernatants from the plated cells (300 µl) are mixed with equal volumes of Griess reagent (1% sulphanilamide (SA)/0.1%naphthylethylenediamine dihydrochloride (NEA)/ 2.5% phosphoric acid). After 10 min incubation at room temperature, the absorbance of the formed chromophore is measured at 550 nm using a spectrophotometer, and NO2 measured using NaN02 as a standard. The Griess test reaction is summarized in Figure 1.
Figure 1.Illustration of the Griess Test Reaction.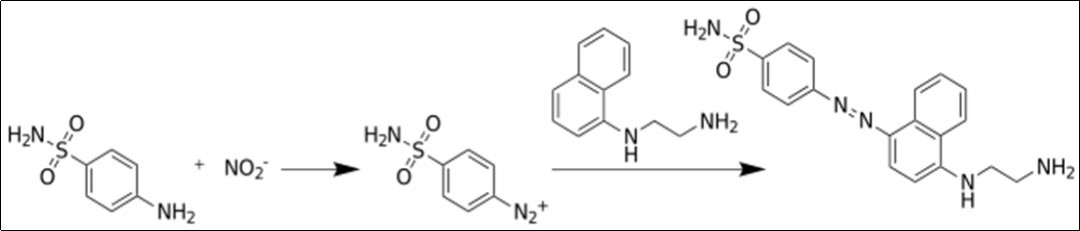
Cytokines Measurement
Pro-inflammatory cytokines such as interleukin-1β (IL-1β), Interleukin-6 (IL-6), Interleukin-8 (IL-8), Interleukin-12 (IL-12) and tumor necrosis factor-α (TNF-α), as well as anti-inflammatory cytokines such as Interleukin-4 (IL-4), Interleukin-10 (IL-10), IL-1 RA and sTNF RI and RII, are measured using flow cytometry multiplex immune assay (luminex) and mouse cytokine ELISA kits as follows:
The enzyme-linked immunosorbent assay (ELISA) is the most common method utilized in research laboratories for the detection and quantification of secreted cytokines, due to its having a number of advantages such as its accuracy, specificity, sensitivity, low cost, ease of implementation, wide availability of cytokines kits for human, mouse and rats, and use of non radioactive agents. Generally, ELISA detects a specific sequence of amino acids (epitope) that binds to an antibody of interest 30. ELISA capture assay format for cytokines analysis is mostly the sandwich assay. The sandwich format is used because it is sensitive and robust. In this type of assay the analyte to be measured is bound between two antibodies – the capture antibody and the detection antibody (either monoclonal or polyclonal) that bind to target sites on the cytokine. The first ‘capture’ antibody is attached to a solid support. The second ‘detection’ antibody that links the captured cytokine to a common detection system is either biotinylated, or is conjugated to a detector enzyme, most commonly horseradish peroxidase, which produces spectrophotometrically measured color that is proportional to the concentration of the tested cytokine 31. A drawback of the ELISA method is that it only detects one allergen per test, requiring a large sample volumes, and an extensive labor, which could limit its effectiveness 32.
In order to partially overcome this drawback, sequential ELISA methods have been introduced in which the same sample is repeatedly employed in different detection cycles. Depending on the high binding specificity between the antibody and the antigen, in each cycle only the selected marker (cytokine) will bind to its specific antibody, leaving the other cytokines in the sample, which will be selected during other cycles. Recently, Multi-Analyte ELIS Array Kit has been available for multiple cytokines detection, using the same ELISA Kit 33, 34.
In this proposed research, mouse Inflammatory Cytokines Multi-Analyte ELISArray Kit from Qiagen (Valencia, CA) will be employed. The kit is designed to survey a specific panel of 12 pro- and anti- inflammatory cytokines at once, using a conventional ELISA protocol under uniform conditions. The cytokines & chemokines represented by this array are IL1A, IL1B, IL2, IL4, IL6, IL10, IL12, IL17A, IFNγ, TNFα, G-CSF, and GM-CSF. Cytokines analyses will be carried out according to the manufacturer’s instructions. Quantitative data are obtained by measuring the optical density at wavelength (λ) 450 nm, using a microplate spectrophotometer. All standard curves are generated with the standard solutions provided with the test kits. Data analysis is carried out using data collection analysis software Gen5 (Biotek, Winooski, Vermont, USA). Calibration curves are constructed from three replicates ateach point of the standard curves. ELISA measurements is obtained in duplicates for each sample, and all experiments will be performed twice.
Recently, flow cytometry technique has been introduced for cytokines' detection. One of its key advantages is the potential to simultaneously detect multiple cytokines. It is an automated fluorescent microsphere-based multiplex immunoassay that employs Multi-Analyte Profiling (xMAP) technology. The xMAP technology, in theory, enables multiple (up to100) microsphere sets to be distinguished simultaneously as each bead set is encoded by two fluorescent dyes, red and orange. The flow cytometer has a dual laser, red and green. The system’s red laser is used to excite the bead fluorescent in order to identify the bead set. Each bead set capture a specific cytokine antibody. The captured cytokines are detected through an immunoassay where a detector antibody (secondary antibody) conjugated with phycoerthrine (PE), which emits at λ 585 nm, and that will be measured using the system’s green laser. Coupled beads will be analyzed using a Luminex analyzer according to the system manual, in which each tested cytokine will be identified through distinctive fluorescence of the coupled bead, and the quantity of each cytokines is determined from the phycoerthrine fluorescence intensity. Flow cytometry, enhances ease-of-use and automation, and markedly reduces the time and labor required for cytokines detection and quantification 31, 35, 36. In the proposed research, flow cytometry are the primary assay platform for cytokines detection, using the Bio-Plex Pro™ mouse cytokine 23-plex immunoassay kit (Bio Rad, Herculese, CA) that simultaneously detects the following 23 cytokines (see Table 2) in the same sample.
Table 2. Cytokines Proposed for Studying| . IL-1α | . IL-10 | . IFN-γ |
| . IL-1β | . IL-12 (p40) | . KC |
| . IL-2 | . IL-12 (p70) | . MCP-1 (MCAF) |
| . IL-3 | . IL-13 | . MIP-1α |
| . IL-4 | . IL-17A | . MIP-1β |
| . IL-5 | . eotaxin | . RANTES |
| . IL-6 | . G-CSF | . TNF-α |
| . IL-9 | . GM-CSF |
Among these measured cytokines, TNF-α and IL-1β are particularly relevant. Several literatures have related these two cytokines to the activation of NF-kB pathway 37, 38, 39.
Effects Measured in a Nuclear Factor-κB
NF-κB signal transduction pathways have different nodes which may be regulated by the probiotics preventing the activation of NFκB and influencing downstream cytokine secretion. In the NF-κB reporter gene cell line, four copies of the NF-κB consensus transcriptional response element are in conjunction with minimal cytomegalovirus (mCMV) promoter. The green fluorescent protein (GFP) and the luciferase reporter genes are under the regulation of a NF-kB response element. Activation of NF-κB pathway leads to the activation of the promoter genes, which in turn activates the expression of reporter genes (firefly luciferase or GFP) as illustrated in Figure 1. The NF-κB pathway will be monitored in vitro using NF-κB/293/ GFP-Luc cell line, System Biosciences (SBI). Addition to the reaction catalyzed by Luciferase reporter gene with luciferin to produce light. Relative light intensity is measured for quantitative transcription activation reporter assays 40, 41.
Expression of GFP reporter gene activation will be measured by flow cytometry through the detection of GFP reporter gene fluorescence. The activities of firefly luciferases will be measured by adding Luciferase Assay Reagent II (LAR II) to generate a stabilized luminescent signal, which is then measured by a luminometer plate reader according to the manufacturers’ instructions.
The change in the activity of NF-κB signaling pathway is determined by comparing the GFP and luciferase activities in treated versus untreated transfectants. The identically treated negative control transfectants serve as a specificity control. The positive control serves as a control for transfection efficiency. The three most powerful bacterial strains presenting highest inhibition of LPS-induced NO production, along with the lowest activation of NFκB, will be selected for in-vivo animal studies.
NF-κB/293/GFP-Luc™ Transcriptional Reporter Cell Line. (http://www.systembio.com/downloads/ TR860_Web_Manual.pdf). Figure 2
Figure 2.Activation of NF-κB pathway leads to the activation of the promoter genes, which in turn activates the expression of reporter genes (firefly luciferase or GFP).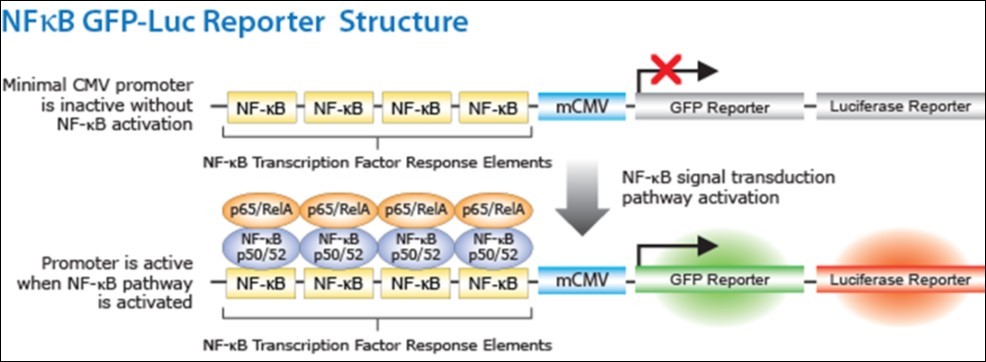
Evaluate the selected probiotics by employing in vivo studies in mice models to elucidate the mechanism by which probiotics affect signaling pathways, and using gene expression analysis to develop microRNA biomarkers for the different anti-inflammatory activities
1.The 1st part of this objective has been to employ in vivo studies in mice to elucidate the mechanism by which probiotics affect signaling pathways. Specifically, this involves studying the effect of probiotics on the nuclear factor NFκB in response to different inducing agents such as TNF-α or LPS, MAPKs, and transcriptional regulators such as heat shock transcription factor 1 and PPARγ.
Animal Model
All studies are approved by the local animal ethics committee. Mice strain C57BL/6J (C57 black 6) will be used. It's genome was initially published in 2002 42 while its finished genome assembly was published in 2009 43 making it the second mammalian species to get its entire genome sequenced after publishing the initial sequence of the human genome in 2001 44 and the complete human genome sequence in2004 45. This strain is recommended to for explore human disease providing the most powerful model for studying gene expression regulation 42. Moreover, it has the advantage of strain stability and easy breeding.
In this research different mouse models are used, in which each group of mice contains equal numbers of males and females as has been recommended by Mogil and Chanda, 2005 46. Mice are housed in plastic cages (5 or 6 mice/cage). The mean initial body weight at approximately 4 weeks of age is recorded and then mice will be divided into many dietary groups, and fed either a control diet or one of probiotics enriched diets. A standard diet is used. Diets and water will be provided daily and body weights and food intake will be recorded weekly. The animals are kept in cages under standard conditions (21–25oC, 50±10% humidity with a 12 h day–night cycle). After a 6 week feeding period, mice are anesthetized with CO2 following an overnight fast. Following this general procedure different model of animal trials are used.
Animal, Ethics Justification and Experimental Design
From both economical and ethical point of view, the experiments are designed in order to obtain significant results using the minimum number of animals. This will reduce the cost of the animals and their care, allowing for an efficient use of the resources, in addition to being scientifically and ethically justifiable. A recent study concluded that a comparable and statistically powerful result could be obtained using one third of the number of the animal that have been used in some literature. The results highlight the importance of using the correctly identified experimental unit (number of mice for each group) in a well designed bias free study 47. As such, for each experiment the group size is determined using power analysis 48. Power analysis has been reported to be the most favored method for calculating the sample size in animal studies 49. Using power analysis, the number of mice required for each group will be calculated from the literature depending on the factor to be measured and the expected variance in this measure (noise), which ensures that the animals are capable of responding, giving a good measurement of analyzed factor “signal” so that there is a high signal/noise ratio.
The formula used to calculate the sample size is: Sample size = 2 SD2 (1.96 + 0.842) 2/d2, where:
SD = Standard deviation (from previous studies, or pilot study).
1.96 obtained from Z table at type 1 error of 5%.
0.842 obtained from Z table for 80% power.
d = effect size = difference between mean values representing the signal 49.
The First Model of Animal Trials
The dextran sulfate sodium (DSS)-induced colitis model is used. DSS animal model has been reported as a powerful model for investigating colitis-related colon carcinogenesis pathogenesis and chemoprevention 50. DSS will be introduced to the mice in their drinking water to induce colitis which is a chronic condition marked by an inflammation of the and a significant increase of the inflammatory cytokines and macrophages 51. DSS induce a defect in epithelial barrier function, due to its cytotoxic effect. This defect in the colonic mucosal barrier subsequently leads to emergence of various inflammatory cells, macrophage activation and pro-inflammatory cytokine production 52. The effect of each selected probiotics strain on the induction of colonic inflammation is then investigated.
Sample Size
In literature where DSS-induced colitis model were used 51, 52, 53, applying power analysis using disease activity index as a signal factor, showed that the number of mice to be used in each group should be between 4 -6 using 80% power factor assuming a 5% significance level and a two sided test, after considering 10% loss of the animals during the course of the experiment due to dying or for any other reason. Indeed, literature have quoted use of 6 mice 51, 8 mice 52, or 10 53. As such, 30 mice of each sex will be divided to 5 groups of 6 mice each/group/sex.
Duration of the study: The study lasted 3 weeks in addition to one week acclimatization to allow animals to habituate to the animal unit in which they are housed before initiation of experiments.
Experimental Procedure
The model used is described by Osman et al 53. Briefly, six- to 8-week-old C57BL/6J mice weighing from 20 to 25 g are obtained from The Jackson Laboratory (Bar Harbor, ME). Mice are divided into five groups. One group of animals will be a negative control (does not receive either DSS or probiotics), and the rest four group swill receive colitis. The colitis control group will receives DSS without probiotics administration. One of the three tested probiotics strains will be administered for each group (except for the negative control and the colitis control as mentioned before).
Normal saline (vehicle) in the colitis control group or the tested bacterial strain (3 ml; 3x 10⁹ CFU of each probiotic strain per animal will be administered orally (once/day) for 7 days before starting DSS and continued for 7 days after DSS induction. DSS of molecular weight 36 000 to 50 000 Da will be obtained from MP Biomedicals (Aurora, OH, USA). Colitis will be induced by 5% (w/v) dissolved in drinking water for 7 days.
The severity of colitis is assessed daily using a disease activity index (DAI) according to which scores changes in body weight, stool consistency, and evidence of intestinal bleeding are used 51. A scoring scale from 0-4 will be used for the weight loss for 0% change, <5% change, <10% change, <20% change, and>20% change, respectively. Stool consistency, however, is scored as 0 for normal, 2 for loose stool and 4 for diarrhea. Finally, gross bleeding will be scored as 0 for negative, 2 for hemoccult and 4 for gross bleeding. DAI will be calculated as the third of the combined score of the three parameters; this method is reported to correlate well with the inflammation level, crypt score and inflammatory bowel disease (IBD) 51.
After sacrifice, the mice colon (approximately 10 cm long) is harvested from the colocecal junction to the anal verge. The colon is opened and cleaned from fecal material by thorough rinsing in 0·9% saline. Gross morphological changes are observed in the opened colon in addition to the presence of blood. The colon will be divided into three equal parts presenting the proximal, middle and distal portion of the colons for histopathological analysis, cytokines measurements and RNA isolation, respectively. Each segment measures about 3 centimeters long. The distal portion of colons is fixed in neutral buffered formalin and then evaluated histopathologically. Colonic histological evaluation is carried out as described by Fitzpatrick et al 52. Briefly, histological damage is determined based on inflammation severity and extent, in addition to crypt damage and epithelial erosion. For the assessment of the severity of colitis, histological scores of the proximal, middle and distal portion of the colons is determined, and the average calculated (see Table 3).
Table 3. Colonic histological evaluation| Histological changes | Score | |||
| 0 | 1 | 2 | 3 | |
| Severity of inflammation | None | Mild | Average | High severity |
| Extent of inflammation | None | Mucosa | Mucosa and sub mucosa | Transmural (full-thickness) |
| Crypt Damage percent | 33% | 66% | 100% with surface | 100% |
| Epithelial erosion | None | Mild/focal | Evident/diffuse | Evident/diffuse |
Laser Capture Microdissection of Inflamed Colon Tissue
Because the presence of stromal cells in excised inflamed tissue might obscure differential cell-specific gene expression profile, we will employ GEM Tox Arcturus Pix Cell II LCM System (Applied Biosystems, Foster City, CA), which produces 5-50 ms infrared laser pulses, 2-30 µm from above, allowing selective adherence of certain cells to a vinyl acetate thermoplastic polymer film that is bound to a sterile plastic cap 54, 55, 56.
Tissue specimens that have been embedded in Tissue Tek OCT before freezing will be longitudinally sectioned at 7 m in a cryostat to capture bottom mature crypt colon cells. Sections are picked up on a supporting poly-1-lysine foil mounted on non-charged microscope slides to ensure that tissue stays on during staining. The target area selected by our Collaborating Pathologist is chosen for LCM. The slides will be fixed for 1 min in 75% ethanol, dipped in nuclease free water for 30 s, stained with 1% Crystal Violet Acetate (Sigma, St. Louis, MO) for 30 s, rinsed in 75%, 95% and 100% ethanol for 30 s each, and air dried. We found this procedure to result in less RNA degradation than traditional H&E staining.
The second segment of the excised colon is snap frozen in liquid nitrogen and stored at -80°C until used for cytokines levels measurement. The last segment will be stored by submerging in RNAlater® solution (Invitrogen, Life Technologies) to maintain the quality and integrity of subsequently isolated RNA for molecular studies.
For serum biochemical analyses, the blood is also collected in EDTA tubes and centrifuged to generate plasma. Cytokines level measurement will be determined in both colon tissue and blood as mentioned above.
The Second Model of Animal Trials
The second model of animal trials is mice strain C57BL/6J with a deficiency in low density lipoprotein (LDL) receptor (B6.129S7-Ldlrtm1Her/J). Mice with such mutation have an elevated serum cholesterol level of 200-400 mg/dl, and have very high cholesterol levels (>2,000 mg/dl) when fed a high fat diet, compared to a serum cholesterol level of 80-100 mg/dl for normal mice. This strain has been widely used as a model to mimic human atherosclerosis. Using this model, the prevention effect of probiotics on diet-induced fatty liver disease in hyperlipidemia mice fed a highly palatable energy-rich obesogenic diet will be evaluated. Duration of the study: The study lasted for 6 weeks in addition to one week to allow animals to habituate to the animal unit before initiation of the experiments. During the six weeks of study, the animals are fed ad-libitum (free feeding) fed the diets described below.
Sample Size
As such, 40 mice/sex are used and divided to 5 groups of eight mice/sex according to power analysis, using as a signal factor a 80% power, assuming a 5% significance level and a two sided test after considering 10% loss of the animal during the course of the experiment due to death or any other reason.
Experimental Procedure
Mutant strain, Ldlr−/− C57/BL6 mice (strain B6.129S7-LDLrtm1Her, Jackson Laboratory, Bar Harbor, ME), are used in this study. One group of mice are designated as the low fat negative control (LF-Con) group and will be fed an AIN-93M (diet containing 5.2% fat by weight). Conversely, the other four groups are fed high fat Western style diet (containing 21% by weight milk fat, 0.2% cholesterol), as shown in Table 4. Out of these high fat fed mice, one group is designated as a positive control. The tested bacterial strain (3 ml; 3x 10⁹ CFU of each probiotics strain) are provided daily to the six groups/sex of the mice fed hi fat diet.
Table 4. Low fat and hi fat diet compositions to be used in the study 57| Formula (percentage g/100g) | Low fat | Hi fat |
| Casein | 19.5 | 20.4 |
| DL-Methionine | 0.3 | 0.312 |
| Sucrose | 12 | 35.721 |
| Corn Starch | 43.3 | 15.691 |
| Maltodextrin | 10 | - |
| Anhydrous Milk fat | 3.72 | 16.529 |
| Soybean Oil | 1.28 | 0.826 |
| Cellulose | 5 | 5.23 |
| Cholesterol | - | 0.157 |
| Mineral Mix, AIN-76 (170915) | 3.5 | 3.661 |
| Calcium Carbonate | 0.4 | 0.418 |
| Vitamin Mix, Teklad (40060) | 1 | 1.046 |
| Ethoxyquin, antioxidant | 0.001 | 0.004 |
Feces of each mouse is collected during the study and air dried. Blood is also collected. Adipose tissue, liver, muscle and heart tissue is harvested and divided to 3 parts. The first part is homogenized, weighed, snap frozen and stored at -80°C until use. The total amount of cholesterol, triglycerides, free fatty acids (FFA) is measured in the plasma samples. Total lipids, total triglycerides and cholesterol is measured in frozen tissues. Also, total lipids will be measured in dried feces for total fat excretion measurement. The other two parts of colon tissues will be used for cytokine measurements and miRNA analysis as described in the first model.
The 2nd Part of this Objective is Developing miRNA Biomarkers for the Different Inflammation Activities
Many miRNAs have been reported to be related to inflammation such as miRNA-155 during the macrophage inflammatory response 58, 59; miR-146a was found to be a NF-κB-dependent gene induced by LPS in an NF-κB-dependent manner 60. Moreover, miR-155, miR-21, and miR-126 have been reported to contribute to vascular inflammation and diseases 61. With regard to endothelial cell function regulation, a few specific miRNAs have been validated. Cell-specific targeting with miRNAs is an important area of investigation to be developed. Further studies need to analyze the complex interactions between endothelial-specific miRNAs and their targets during angiogenesis. Identification of miRNAs and their targets and better understanding of in vivo mechanisms is critical for the development of miRNA drugs of specific molecular clinical therapy targets 62.
Extraction of Total RNA & Preparation of ss-cDNA
A procedure that we used for extracting total RNA from laser capture microdissected (LCM) tissue or from stool is carried out using a guanidinium-based buffer, which comes with the RNeasy isolation Kit®, Qiagen, Valencia, CA, USA, as we have previously detailed 63. Purity of total RNA is measured spectrophotometrically at 260 nm and 280 nm. The fragility of total RNA is determined on an Agilent 2100 Bioanalyzer (Agilent Technologies, Inc., Palo Alto, CA, USA) utilizing the RNA 6000 Nano LabChip® 64. The Sensiscript RT Kit® from Qiagen will be employed for making a copy of ss-DNA in a 7.5l reverse transcription (RT) reaction containing total RNA, 50 nm stem-loop RT primer, 1 X RT buffer, 0.23 nm of each of dNTP, 3.33 U/µl multiscriptase reverse transcriptase 63.
Use Oligonucleotide Microarrays for Measuring Global Micro RNA Expression
Systematic investigation of miRNA for a universal coverage using microarray expression profiling 65 that employ Affymetrix GeneChip miRNA 3.0 array (Affymetrix, Inc, Santa Clara, CA), which provides for 100% miRBase v17 coverage (www.mirbase.org) by a one-color approach, is carried out as we described before 66. Briefly, the enriched fraction for miRNA profiling studies is obtained by passing 10 μg of high quality, undegraded total RNA through a flash PAGETM Fractionator apparatus (Invitrogen). RNA molecules will be tailed and labeled using a 3DNA Array Detection Flash Tag Biotin HSR microarray technology (Genisphere LLC, Hatfield, PA). The fluorescence on the array is scanned using an Affymetrix GCS3000 Gene Array Scanner with a high resolution 6g patch. Thresholding and signal is generated using appropriate algorithms. The background adjusted fluorescent values generated by the scanner is normalized for each miRNA using a variation stabilization transformation method such as cyclic LOWESS, as we detailed earlier 66. Hypothetical testing with one-way analysis of variance (ANOVA) or Student’s t-test is employed for statistical analysis of miRNA arrays. P-values < 0.05 are considered significant. Reproducibility and linearity are evaluated using ANOVA or Pearson correlation coefficients. Pair-wise comparisons is carried out on differentially expressed genes identified by ANOVA. For each pair of treatments, a two-sample t-test is carried out for every gene & multiplicity correction is followed to control the false discovery rate (FDR) using a step-up approach known as protected least significant difference, LSD. Pairwise volcano plots will be generated for measuring over- or under-expressed miRNAs 67.
Amplifying MicroRNA and Measuring its Expression by Quantitative PCR
A few microliters of ss-cDNA is subsequently amplified by PCR, employing a two-step format, permitting reverse transcription and amplification to be performed separately under optimal conditions. We will then use modified Taxman-based semi-quantitative(q) real-time PCR assay that includes mi RNA-specific tailed stem-loop forward primer that bind at the 3’ portion of miRNA molecules, reverse primer and a dye-labeled hydrolysis Tasman®minor groove binding (MG) probe (Applied Bio systems) 68, which collectively improve the thermal stability (Tm) depending on the sequence composition of the assayed miRNA molecule, extends the effective footprint of RT primer/RNA duplex that may be required for effective RT from relatively shorter RT primers, and prevents them from binding double strand (dd) genomic DNA molecules, and therefore prevent amplification of any potential genomic DNA contaminants that may be present in the preparation 69.
Figure 3. Schematic Description of the Tasman® miRNA Assay from reference [68]
Figure 3. Activation of NF-κB pathway leads to the activation of the promoter genes, which in turn activates the expression of reporter genes (firefly luciferase or GFP). For analysis of crap results, we employed the comparative cross point (CO) value (or E-method) 70 using the Highlighter (LC) Quantification Software™, Version 3-5 71 for a Roche 480 PCR instrument (Mannheim, Germany). In that method, standard concentrations are plotted versus the threshold cycle to calculate the expression of miRNA genes automatically without user’s input, with high sensitivity and specificity calculations 72. A CO value corresponds to the cycle number at which each well has the same kinetic properties. The CO method corresponds to the 2-TACT method 73 used by other PCR instruments, although the latter method produces reliable quantitative results only if the efficiency E= 10 of the PCR assay for both target and reference genes are identical and equal to 2 (i.e., doubling of molecules in each amplification cycle) 74; for example if well A1 has a CP value of 15 and well A2 has a CP value of 16, we deduce that there is twice as much of the gene of interest in well A1. A 10-fold difference is shown by a difference of ~ 3.3 CP value.
Figure 3.Real-time quantification of microRNA byStem-loop RT-PCR (from Reference 68).
Normalization of PCR data is carried out against endogenous housekeeping internal standards such, as 18S rRNA gene, RNU6 and any of three stably-expressed human miRNA (let-7a, miR-16 and miR-103) 75, 76, to ascertain unbiased normalization and elimination of spurious data, and to give consistent and reliable results for normalizing of PCR expression of miRNAs 77.
The Third Objective is Employing an in-vivo Mouse Model to Evaluate the Effect of three Different Nutrients and Dietary Components on Developed Biomarkers in Health States.
The following three nutrients have been tested: n-3 poly unsaturated fatty acids (PUFA), vitamin D and selenium. The long chain n-3 PUFA of marine origin, specially EPA (eicosapentaenoic acid) and DHA (docosahexaenoic acid), have been reported to have anti-inflammatory properties that reverse and prevent the adipose tissue inflammation and insulin resistance induced by a high fat by reducing plasma triglycerides and exhibiting antiobesity effects. The mode of action of PUFA is through affecting the adipose tissue function increasing the secretions of hormones such as adiponectin, leptin and visfatin. These hormones regulating energy intake, energy expenditure, glucose levels and fatty acid breakdown.These fatty acids increase the production of adiponectin through PPARу dependent mechanism. Moreover, EPA and DHA modulate cytokines production through aNF-kB dependent mechanism. This modulation includes reducing the production of pro-inflammatory cytokines including TNFα, IL-6, MCP-1, and PAI-1; and increase anti-inflammatory cytokine such as IL-10. Finally, EPA and DHA increase the oxidation of fatty acid and lower lipid accumulation in adipocytes 78. Vitamin D has been reported to reduce insulin resistance and affect the promoter region of cytokine genes. Such effect regulates glucose homeostasis, stimulates lipogenesis and reduces systemic inflammation induced by TNFα and IL6 79. In addition, vitamin D have an anti-inflammatory effect as it suppress the release of TNFα and up-regulates the synthesis of the anti-inflammatory cytokine IL-10 and induces IL-10 receptor expression 80. Selenium deficiency has been reported to affect inflammation contributing to higher cancer risk in selenium deficiency states due to its incorporated into selenoproteins and its effect on the expression of non-selenoprotein 81. Interestingly, moderate deficiency of selenium has been reported to down regulate inflammation related genes inducing an impaired NF-κB signaling 82.
Duration of the study: The study lasted for 6 weeks in addition to one week to allow animals to habituate to the animal unit before initiation of the experiments. During the 6 weeks of study, the animals will be ad-libitum (free feeding) fed the diets described below.
Sample Size
Number of animals used is 12 mice/sex per group according to power analysis using above mentioned parameters. A total of 72 mice/sex for this objective is divided into 6 groups, each of 12 mice/sex.
Experimental Procedure
Mice used for testing this aim are JAX® Diet-Induced Obesity (DIO) model: http://jaxmice.jax.org/diomice/index.html, and not the LDL mutant strain used in Aim 2. Seven weeks old mice will be used in which the control group mice is fed on 10% kcals from fat diet, and same age matched intervention group mice fed on 60% kcals from fat diet (Table 5) are purchased from Jackson Laboratory (Bar Harbor, ME). Three double-blind, randomized, placebo-controlled trials will be performed. For each nutrient, we tested two groups only (control and each nutrient separately), as we are comparing each nutrient to the control and no comparisons will be made among nutrients. The control group recieved placebo diet, free of the tested nutrient, while the intervention group will receive diet fortified with the tested nutrient.Different tissues will be collected from the mice as indicated above, while blood samples will be collected over the course of study. Changes in global gene expression will be monitored by microarray analyses 62, and miRNA markers will be measured by stem-loop, TaqMan MGB probe miRNA qPCR assay as detailed before 68. This aim will be achieved during years 4 and 5, and will take 18 months (months 37-54] to complete (see Table 1).
Table 5. Control and intervention diet compositions| 60 kcal% fat diet Intervention group | 10 kcal% fat diet Control group | |||
| gm% | kcal% | gm% | kcal% | |
| Protein | 26 | 20 | 19.2 | 20 |
| Carbohydrate | 26 | 20 | 67.3 | 70 |
| Fat | 35 | 60 | 4.3 | 10 |
| Total | 100 | 100 | ||
| kcal/gm | 5.24 | 3.85 | ||
| Ingredient | gm | kcal | gm | kcal |
| Casein, 30 Mesh | 200 | 800 | 200 | 800 |
| L-Cystine | 3 | 12 | 3 | 12 |
| Corn Starch | 0 | 0 | 506.2 | 2024.8 |
| Maltodextrin 10 | 125 | 500 | 125 | 500 |
| Sucrose | 68.8 | 275 | 68.8 | 275.2 |
| Cellulose, BW200 | 50 | 0 | 50 | 0 |
| Soybean Oil | 25 | 225 | 25 | 225 |
| Lard | 245 | 2205 | 20 | 180 |
| Mineral Mix S10026 | 10 | 0 | 10 | 0 |
| DiCalcium Phosphate | 13 | 0 | 13 | 0 |
| Calcium Carbonate | 5.5 | 0 | 5.5 | 0 |
| Potassium Citrate, 1 H2O | 16.5 | 0 | 16.5 | 0 |
| Vitamin Mix V10001 | 10 | 40 | 10 | 40 |
| Choline Bitartrate | 2 | 0 | 2 | 0 |
| FD&C Yellow Dye #5 | 0 | 0 | 0.04 | 0 |
| FD&C Blue Dye #1 | 0.05 | 0 | 0.01 | 0 |
| Total | 773.85 | 4057 | 1055.05 | 4057 |
The Fourth Objective is Study use Statistics for Data Analysis
The statistical methodology for the analysis of study specific aims has been as follows:
Aim 1
Data consists of cytokine levels obtained for three different probiotics. For each probiotic there will be 4 replicates. Preliminary analysis will consist of numerical summaries and side-by-side boxplots for each of the roughly 23 response variables (cytokine levels). Additionally, scatter plots of pairs cytokine variables will be made to explore the relationship among these variables. One-way analysis of variance may be appropriate to formally compare the probiotics with contrasts being used to address specific questions concerning the relationship among these probiotics. Whether additional analyses are required or warranted will depend on the results of the preliminary analysis. For the issue of multiple comparisons among the 23 measured cytokines formal adjustments will be based on the particularly relevant TNF-α and IL-1β as explained in Aim 1.
Aim 2
There are two parts to this aim. The first part involves repeating the steps in Aim 1 for data collected from in vivo assessment. For this aim there will be 6 replicates (6 mice/group/sex). The second part considers whether there is a relationship between the cytokine levels and gene expression levels. Scatter plots are a natural tool for visualizing the relationship between two numeric variables. Since there will be 100 or more genes considered for this aim, this would involve more than 2000 scatter plots. Instead, correlations will be calculated and scatter plots will be assessed for only those with the most extreme numeric value (near -1 or near 1) for correlation coefficient. By specifying a cutoff value to indicate extreme correlations, e.g., above 0.9 or below -0.9 (depending on the experimental results), each cytokine will have associated with it a collection of genes that are strongly correlated with it. The composition of these highly correlated genes across the cytokines will be helpful in identifying the potential role of these genes. Genes whose expression levels are highly correlated with multiple cytokine levels will be studied in the next aim.
Aim 3
We anticipate using about 20 genes obtained from Aim 2. This aim will use 126 mice. The preliminary analysis will consist of treating each of the genes as a univariate response variable modeled on 3 factors: sex (2 levels), probiotic (3 levels), and nutrients (3 levels). Each treatment will have 7 replicates, while the 20 genes can be considered a multivariate response variable. Statistical analysis will be performed using the statistical software R 83, The R Foundation for Statistical Computing, http://cran.r-project.org), and S-plus software (Insightful Corporation, Seattle, WA). This aim is carried out during months 12, 36, 54 and completed by the last 3 months 58, 59, 60 of the study.
The Fifth Objective is to Provide Alternate Standardized Technical Methods for Achieving Study Aims
We have proposed the most practical, least labor-intensive and economical approach to accomplish study aims. However, in a few problematic samples (< 5% based on our experience) in control or diseased cases, it may be necessary to use other methods. However, because the error rate is so small and would occur in control and cases, adopting different extraction/analyses methods will not bias results.
Measuring a Single Cytokine Level by Flow Cytometry
In some cases, measurement repetition is required to account for the variation in the level of one or more cytokines with %CV more than 15%. The mouse cytokine 23-plex immunoassay kit in not economically practical to be used for such purpose. To overcome this difficulty, a single cytokine flow cytometry analysis will be developed as follows: Anti-cytokine specific antibody pair (monoclonal antibody for capture reporter, polyclonal antibody for detection) will be obtained from Abcam (Cambridge, MA).The capture antibody will be coupled to magnetic COOH flow cytometry beads using protein coupling kit (Bio-Rad, Hercules, CA). Detection (reporter) antibodies will be obtained by conjugating the pre-mentioned capture antibodies to phycoerythrin (PE) using a Phycolink R-Phycoerythrin (RPE). Cytokine flow cytometry measurement will be performed using the prepared antibodies as described before.
Measuring a Single Cytokine Level by ELISA
For the same reason detailed in 1 above, a single cytokine commercial ELISA kit (Endogen, Inc., Woburn, MA) will be used to measure the concentrations of the specific cytokine.
Manual Extraction of Total RNA from Problematic Samples Using the AGPC Method
In very few samples, inhibitors present in stool may make it difficult to isolate RNA using Qiagen kits that provide the advantage of manufacturer's established validation and QC standards. In such cases we will manually isolate RNA by a modification of the classical acid guanidinium thiocyanate-phenol-chloroform (AGPC) method 84 using chaotropic guanidinium thiocyanate (GSC) that inactivates ribonucleases and most microorganisms.
Use of RT2 Focused PCR Arrays to Study Gene and Micro RNA Expression
Qiagen (SABioscience, Frederick, MD) introduced a focused human PCR array in a 96 well plate containing 88 cancer-related mRNA or miRNA genes, 4 normalization housekeeping synthetic miRNA genes, 2 RT controls and 2 controls to test the efficiency of the qPCR reaction. These focused arrays could be used to study miRNA expressions by a universal multiplex qPCR assay, in which a single cDNA preparation can quantitatively assay 88 miRNA genes with high specificity due to the use of universal primers containing a modified oligonucleotide 85.
Use of Locked Nucleic Acid-Based qPCR for miRNA Profiling
LNAsTM are conformationally restricted nucleotide analogs in which the ribose moiety of an LNA nucleotide is modified with an extra bridge connecting the 2' oxygen and 4' carbon. The bridge "locks" the ribose in the 3'-endo conformation, which enhances base stacking & backbone preorganization, significantly increasing Tm of nucleotide capture probes & improving mismatch discrimination of the target leading to better hybridization properties 86. Exiqon’s miRCURY LNATM Universal RT miRNA PCR System (Exiqon A/S, Vedbaek, Denmark) contains two miRNA specific primers, allowing accurate quantification of individual miRNAs from a 1 pg total RNA.
Use of a Plate Assay to Study MicroRNA Expression
Signosis, Inc., Sunnyvale, CA (www.signosisinc.com) introduced high throughput plate assay for monitoring individual miRNAs, without the need to carry out a RT reaction. In that assay one of the bridge oligos partially hybridizes with the miRNA molecule and the capture oligo, and another bridge forms a hybrid between the miRNA molecule and the detection oligo. The hybrid that is sensitive to the miRNA sequence is immobilized onto a plate and detected by a streptavidin-horse radish peroxidase conjugate and chemiluminescent substrate using a plate reader. One oligonucleotide difference prevents hybrid formation; thus miRNA isoform could be differentiated.
If needed, this aim using alternate approaches will be carried out during months 12, 36, 54 and 58, 59, 60.
Expected Outcomes from this Study
The expected clinical outcomes of this study include: Identifying cytological and molecular biomarkers that could be used as screening tools to promote health and/or prevent disease, and providing genetic information on how probiotics and nutrients may affect the host metabolism and influence the development of obesity, diabetes, and specific cancers. In addition, results from this study will increase the understanding of the regulatory effect of nutrients and dietary factors at the molecular level.
Acknowledgements
We express our thanks to Dr. Paul W. Vos of the Department of Biosatistics, Eact Carolina University, School of Allied Health Sciences, for his advice on statistical analysis.
References
- 1.Jia W, Li H, Zhao L, J K Nicholson. (2008) Gut microbiota: A potential new territory for drug targeting. , Nature Reviews Drug Discovery 7, 123-129.
- 2.A J Macpherson, N L Harris. (2004) Interactions between commensal intestinal bacteria and the immune system. , Nature Reviews Immunology 4, 478-485.
- 3.Weng M, Walker W A. (2006) Bacterial colonization, probiotics, and clinical disease. , Journal of Pediatrics 149, 107-114.
- 4.D A Peterson, D N Frank, N R Pace, J I Gordon. (2008) Metagenomic Approaches for Defining the Pathogenesis of Inflammatory Bowel Diseases. , Cell Host and Microbe 3, 417-427.
- 5.Beausoleil M, Fortier N, Guénette S, L'Ecuyer A, Savoie M et al. (2007) Effect of a fermented milk combining Lactobacillus acidophilus CL1285 and Lactobacillus casei in the prevention of antibiotic-associated diarrhea: A randomized, double-blind, placebo-controlled trial. , Canadian Journal of Gastroenterology 21, 732-736.
- 6.Hol J, Leer E H G van, Schuurman Elink, B E E, Ruiter L F de et al. (2008) The acquisition of tolerance toward cow's milk through probiotic supplementation: A randomized, controlled trial. , Journal of Allergy and Clinical Immunology 121, 1448-1454.
- 7.P Van Baarlen, Troost F, Meer C Van Der, Hooiveld G, Boekschoten M et al. (2011) Human mucosal in vivo transcriptome responses to three lactobacilli indicate how probiotics may modulate human cellular pathways. Proceedings of the National Academy of Sciences of the United States of America 108 4562-4569.
- 8.C M Thomas, Versalovic J. (2010) Probiotics-host communication modulation of signaling pathways in the intestine. , Gut Microbes 1, 1-16.
- 9.X C Li, J L Zhuo. (2008) Nuclear factor-κB as a hormonal intracellular signaling molecule: Focus on angiotensin II-induced cardiovascular and renal injury. , Current Opinion in Nephrology and Hypertension 17, 37-43.
- 10.T D Gilmore. (2006) Introduction to NF-κB: Players, pathways, perspectives. , Oncogene 25, 6680-6684.
- 11.C S Eun, D S Han, S H Lee, Y C Jeon, J H Sohn et al. (2007) [Probiotics may reduce inflammation by enhancing peroxisome proliferator activated receptor gamma activation in HT-29 cells]. , Korean J Gastroenterol 49, 139-146.
- 12. (2001) FAO/WHO: Report on Joint FAO/WHO Expert Consultation on. Evaluation of Health and Nutritional Properties of Probiotics in Food Including Powder Milk with Live Lactic Acid Bacteria .
- 14.Ahrne S, Hagslatt M L J. (2011) Effect of lactobacilli on paracellular permeability in the gut. , Nutrients 3, 104-117.
- 15.Zhang L, Li N, Caicedo R, Neu J. (2005) Alive and dead Lactobacillus rhamnosus GG decrease tumor necrosis factor-α-induced interleukin-8 production in Caco-2 cells. , Journal of Nutrition 135, 1752-1756.
- 16.L A Dieleman, M S Goerres, Arends A, Sprengers D, Torrice C et al. (2003) Lactobacillus GG prevents recurrence of colitis in HLA-B27 transgenic rats after antibiotic treatment. , Gut 52, 370-376.
- 17.Khan S, Lopez-Dee Z, Kumar R, Ling J. (2013) Activation of NFkB is a novel mechanism of pro-survival activity of glucocorticoids in breast cancer cells. , Cancer Letters 337, 90-95.
- 18.Agami R, Kedde M, M van Kouwenhove, Zwart W, Vrielink Oude et al. (2010) Cancerous microRNAs and regulatory RNA binding proteins. , European Journal of Cancer Supplements 8, 7.
- 19.R C Lee, R L Feinbaum, Ambros V. (1993) The C. elegans heterochronic gene lin-4 encodes small RNAs with antisense complementarity to lin-14. , Cell 75, 843-854.
- 22.E M Quinn, J H Wang, O’Callaghan G, H P Redmond. (2013) . MicroRNA-146a Is Upregulated by and Negatively Regulates TLR2 Signaling, PLoS ONE 8 62232.
- 23.M von Brandenstein, Richter C, Fries J W U. (2012) MicroRNAs: Small but amazing, and their association with endothelin. , Life Sciences 91, 475-489.
- 24.Hussein L, Mohammad M, Gouda M, Tawfik M, Labib E et al. (2014) Dietary intervention with fermented supplements and impact on intestinal permeability and colonic metabolic activities. Submitted
- 25.Henriksson A, Khaled A K D, P L Conway. (1999) . Lactobacillus Colonization of the Gastrointestinal Tract of Mice After Removal of the Non-Secreting Stomach Region, Microbial Ecology in Health and Disease 11, 96-99.
- 26.Lee Y-K, Salminen S. (1995) The coming of age of probiotics. , Trends in Food Science & Technology 6, 241-245.
- 27.Jr Hibbs, B J, R, Vavrin Z. (1987) Macrophage cytotoxicity: Role for L-arginine deiminase and imino nitrogen oxidation to nitrite. , Science 235, 473-476.
- 28.M Di Rosa, Radomski M, Carnuccio R, Moncada S. (1990) Glucocorticoids inhibit the induction of nitric oxide synthase in macrophages. , Biochemical and Biophysical Research Communications 172, 1246-1252.
- 29.Wang Z, Liu X, Yang M, An S, Han X et al. (2014) Electrochemical detection of nitrite based on difference of surface charge of self-assembled monolayers. , International Journal of Electrochemical Science 9, 1139-1145.
- 30.M F Osuchowski, D G Remick. (2006) The repetitive use of samples to measure multiple cytokines: The sequential ELISA. , Methods 38, 304-311.
- 31.Vignali D A A. (2000) Multiplexed particle-based flow cytometric assays. , Journal of Immunological Methods 243, 243-255.
- 32.M F Osuchowski, Siddiqui J, Copeland S, D G Remick. (2005) Sequential ELISA to profile multiple cytokines from small volumes. , Journal of Immunological Methods 302, 172-181.
- 33.Yan H-X, Wu H-P, Zhang H-L, Ashton C, Tong C et al. (2013) p53 promotes inflammation-associated hepatocarcinogenesis by inducing HMGB1 release. , Journal of Hepatology 59, 762-768.
- 34.Xiao J, Zhai H, Yao Y, Wang C, Jiang W et al. (2014) Chrysin attenuates experimental autoimmune neuritis by suppressing immuno-inflammatory responses. , Neuroscience 262, 156-164.
- 35.E B Cook, J L Stahl, Lowe L, Chen R, Morgan E et al. (2001) Simultaneous measurement of six cytokines in a single sample of human tears using microparticle-based flow cytometry: allergics vs. non-allergics. , Journal of Immunological Methods 254, 109-118.
- 36.Ross R, Grimmel J, Goedicke S, A M Möbus, Bulau A-M et al. (2013) Analysis of nuclear localization of interleukin-1 family cytokines by flow cytometry. , Journal of Immunological Methods 387, 219-227.
- 37.Hartigh L J den, Altman R, J E Norman, J C Rutledge. (2014) Postprandial VLDL lipolysis products increase monocyte adhesion and lipid droplet formation via activation of ERK2 and NFκB. , American Journal of Physiology - Heart and Circulatory Physiology 306, 109-120.
- 38.K D Taganov, M P Boldin, Chang K-J, Baltimore D. (2006) NF-κB-dependent induction of microRNA miR-146, an inhibitor targeted to signaling proteins of innate immune responses. Proceedings of the National Academy of Sciences 103: 12481-12486.
- 39.W L, Liu W, H Y Gong, J R Hong, C et al. (2011) Activation of cytokine expression occurs through the TNFα/ NF-κB-mediated pathway in birnavirus-infected cells. , Fish and Shellfish Immunology 31, 10-21.
- 40.Hong H-Y, Choi J, Cho Y-W, Kim B-C. (2012) Cdc25A promotes cell survival by stimulating NF-κB activity through IκB-α phosphorylation and destabilization. , Biochemical and Biophysical Research Communications 420, 293-296.
- 41.S C Miller, Huang R, Sakamuru S, S J, M S Attene-Ramos et al. (2010) Identification of known drugs that act as inhibitors of NF-κB signaling and their mechanism of action. , Biochemical Pharmacology 79, 1272-1280.
- 42.R H Waterston, Lindblad-Toh K, Birney E, Rogers J, J F Abril et al. (2002) Initial sequencing and comparative analysis of the mouse genome. , Nature 420, 520-562.
- 43.D M Church, Goodstadt L, L W Hillier, M C Zody, Goldstein S et al. (2009) and The Mouse Genome Sequencing. , C, PLoS Biol 7, 1000112.
- 44.S L Eric, M L Lauren, Bruce B, Chad N, C Z Michael et al. (2001) Initial sequencing and analysis of the human genome. , Nature 409, 860-921.
- 45.International HumanGenome Sequencing Consortium (2004).Finishing the euchromatic sequence of the human genome. , Nature 431, 931-945.
- 46.J S Mogil, M L Chanda. (2005) The case for the inclusion of female subjects in basic science studies of pain. , Pain 117, 1-5.
- 47.K E Ameen-Ali, M J Eacott, Easton A. (2012) A new behavioural apparatus to reduce animal numbers in multiple types of spontaneous object recognition paradigms in rats. , Journal of Neuroscience Methods 211, 66-76.
- 48.Festing M F W, D G Altman. (2002) Guidelines for the design and statistical analysis of experiments using laboratory animals. , ILAR Journal 43, 244-257.
- 49.Charan J, Kantharia N. (2013) How to calculate sample size in animal studies?. , Journal of Pharmacology and Pharmacotherapeutics 4, 303-306.
- 50.D W Rosenberg, Giardina C, Tanaka T. (2009) Mouse models for the study of colon carcinogenesis. , Carcinogenesis 30, 183-196.
- 51.Murthy S N S, H S Cooper, Shim H, R S Shah, S A Ibrahim et al. (1993) Treatment of dextran sulfate sodium-induced murine colitis by intracolonic cyclosporin. Digestive Diseases and Sciences 38, 1722-1734.
- 52.L R Fitzpatrick, Small J, R A Hoerr, E F Bostwick, Maines L et al. (2008) In vitro and in vivo effects of the probiotic Escherichia coli strain M-17: immunomodulation and attenuation of murine colitis. , Br J Nutr 100, 530-541.
- 53.Osman N, Adawi D, Ahrne S, Jeppsson B, Molin G. (2004) Modulation of the effect of dextran sulfate sodium-induced acute colitis by the administration of different probiotic strains of Lactobacillus and Bifidobacterium. , Dig Dis Sci 49, 320-327.
- 54.A H Owens, D S Coffey, S B Baylin. (1982) Tumor Cell Heterogeneity: Origins and Implications. , New York, NY
- 55.M R Emmert-Buck, R F Bonner, P D Smith, R F Chuaqui, Zhuang Z et al. (1996) Laser capture microdissection. , Science 274, 998-1001.
- 56.F E Ahmed. (2006) Laser microdissection: Application to carcinogenesis. , Cancer Genomics and Proteomics 3, 217-225.
- 57.S T Hasan, J M Zingg, Kwan P, Noble T, Smith D et al. (2014) Curcumin modulation of high fat diet-induced atherosclerosis and steatohepatosis in LDL receptor deficient mice. , Atherosclerosis 232, 40-51.
- 58.R M O'Connell, K D Taganov, M P Boldin, Cheng G, Baltimore D. (2007) MicroRNA-155 is induced during the macrophage inflammatory response. Proceedings of the National Academy of Sciences 104 1604-1609.
- 59.Kurowska-Stolarska M, Alivernini S, L E Ballantine, D L Asquith, N L Millar et al. (2011) MicroRNA-155 as a proinflammatory regulator in clinical and experimental arthritis. Proceedings of the National Academy of Sciences 108, 11193-11198.
- 60.H J Lee, Maeng K, H T Dang, G J Kang, Ryou C et al. (2011) Anti-inflammatory effect of methyl dehydrojasmonate (J2) is mediated by the NF-κB pathway. , Journal of Molecular Medicine 89, 83-90.
- 61.Urbich C, Kuehbacher A, Dimmeler S. (2008) Role of microRNAs in vascular diseases, inflammation, and angiogenesis. , Cardiovascular Research 79, 581-588.
- 62.Wu F, Yang Z, Li G. (2009) Role of specific microRNAs for endothelial function and angiogenesis. , Biochemical and Biophysical Research Communications 386, 549-553.
- 63.F E Ahmed, Vos P, Ijames S, D T Lysle, R et al. (2007) Transcriptomic molecular markers for screening human colon cancer in stool and tissue. , Cancer Genomics and Proteomics 4, 1-20.
- 64.Fleige S, M W Pfaffl. (2006) RNA integrity and the effect on the real-time qRT-PCR performance. , Molecular Aspects of Medicine 27, 126-139.
- 65.C G Liu, G A Calin, Meloon B, Gamliel N, Sevignani C et al. (2004) An oligonucleotide microchip for genome-wide microRNA profiling in human and mouse tissues. Proceedings of the National Academy of Sciences of the United States of America 101 9740-9744.
- 66.F E Ahmed, P W Vos, Jeffries C, J E Wiley, D A Weidner et al. (2009) Differences in mRNA and microRNA microarray expression profiles in human colon adenocarcinoma HT-29 cells treated with either intensity-modulated radiation therapy (IMRT), or conventional radiation therapy (RT). , Cancer Genomics and Proteomics 6, 109-128.
- 67.F E Ahmed. (2006) Microarray RNA transcriptional profiling: Part II. Analytical considerations and annotation. , Expert Review of Molecular Diagnostics 6, 703-715.
- 68.Chen C, D A Ridzon, A J Broomer, Zhou Z, D H Lee et al. (2005) Real-time quantification of microRNAs by stem-loop RT-PCR. , Nucleic Acids Research 33(20), 179.
- 69.F E Ahmed, N C Ahmed, P W Vos, Bonnerup C, J N Atkins et al. (2013) Diagnostic MicroRNA markers to screen for sporadic human colon cancer in stool: I. Proof of principle. , Cancer Genomics and Proteomics 10, 93-113.
- 70.Tellmann G. (2006) The E-Method: A highly accurate technique for gene-expression analysis. , Nature Methods 3, i-ii..
- 72.Luu-The V, Paquet N, Calvo E, Cumps J. (2005) Improved real-time RT-PCR method for high-throughput measurements using second derivative calculation and double correction. , BioTechniques 38, 287-293.
- 73.K J Livak, T D Schmittgen. (2001) Analysis of Relative Gene Expression Data Using Real-Time Quantitative. PCR and the 2−ΔΔCT Method, Methods 25, 402-408.
- 74.S A Bustin, Nolan T. (2004) Data analysis and interpretation. A-Z of quantitative PCR. International University Line In Bustin S. A., editor. (ed.) , La Jolla, CA 439-492.
- 75.Bargaje R, Hariharan M, Scaria V, Pillai B. (2010) Consensus miRNA expression profiles derived from interplatform normalization of microarray data. , RNA 16, 16-25.
- 76.K H Chang, Mestdagh P, Vandesompele J, M J Kerin, Miller N. (2010) MicroRNA expression profiling to identify and validate reference genes for relative quantification in colorectal cancer. , BMC Cancer 10.
- 77.H J Peltier, G J Latham. (2008) Normalization of microRNA expression levels in quantitative RT-PCR assays: Identification of suitable reference RNA targets in normal and cancerous human solid tissues. , RNA 14, 844-852.
- 78.N S Kalupahana, K J Claycombe, Moustaid-Moussa N. (2011) (n-3) Fatty acids alleviate adipose tissue inflammation and insulin resistance: Mechanistic insights. , Advances in Nutrition 2, 304-316.
- 79.Dutta D, S A Mondal, Choudhuri S, Maisnam I, Reza Hasanoor et al. (2014) Vitamin-D supplementation in prediabetes reduced progression to type 2 diabetes and was associated with decreased insulin resistance and systemic inflammation: An open label randomized prospective study from Eastern India, Diabetes Research and Clinical Practice.
- 80.Schleithoff S S, Zittermann A, Tenderich G, H K Berthold, Stehle P et al. (2006) Vitamin D supplementation improves cytokine profiles in patients with congestive heart failure: a double-blind, randomized, placebo-controlled trial. , The American Journal of Clinical Nutrition 83, 754-759.
- 81.Kipp A, Banning A, Schothorst E M van, Méplan C, Schomburg L et al. (2009) Four selenoproteins, protein biosynthesis, and Wnt signalling are particularly sensitive to limited selenium intake in mouse colon. , Molecular Nutrition & Food Research 53, 1561-1572.
- 82.A P Kipp, Banning A, Schothorst E M van, Méplan C, S L Coort et al. (2012) Marginal selenium deficiency down-regulates inflammation-related genes in splenic leukocytes of the mouse. , The Journal of Nutritional Biochemistry 23, 1170-1177.
- 83.R Core Team. (2013) A language and environment for statistical computing, R Foundation for Statistical Computing. , Vienna, Austria
- 84.Chomczynski P, Sacchi N. (1987) Single-step method of RNA isolation by acid guanidinium thiocyanate-phenol-chloroform extraction. , Analytical Biochemistry 162, 156-159.