Water Quality Analysis on Public and Household Water Sources – A Case Study of Sunyani-West District, Fiapre
Abstract
Access to potable and quality water in most rural communities is low such that over 2.2 billion people worldwide are negatively affected. The increasing population in Fiapre and the inconsistent water supply by the Ghana Water Company Limited (GWCL) have forced most residents to resort to alternative groundwater sources such as boreholes, wells, etc. Yet, many residents use these sources of water unaware of the quality of the water and its potential health implications. This study assessed drinking water quality in Fiapre by calculating its Weight Average Water Quality Index (WAWQI) and investigating potential risk factors associated with contamination through a cross-sectional study and laboratory analysis of various physicochemical and microbiological water quality parameters. WAWQI was used to compute parameters using 10 factors including pH, electrical conductivity, temperature, TDS, phosphate, chloride, total hardness, nitrate, alkalinity, and faecal coliform. The findings revealed that the pH level of water, phosphate concentration, and fecal coliform count surpassed the recommended thresholds set by the World Health Organization (WHO) for safe drinking water. Although levels of electrical conductivity, TDS, nitrate, total hardness, and chlorine kept changing from one water source to another, the difference was not significant apart from phosphate and fecal coliform which shows a significant difference between the sachet water sources and other water sources (P<0.05). The study outcomes demonstrated that the overall water quality is predominantly categorized as good to fairly good, with the highest Water Quality Index (WQI) value reaching 87.84% and the lowest recorded at 54.81%. Therefore, to improve the water quality in the municipality, local management agencies should pay attention to the microbiological quality of the water sources. The study recommends regular handwashing practices, hygienic surroundings of the water source, and drinking water treatment to reduce the possible risk factors associated with the contamination of the water sources.
Article Information
- Received
- Accepted
- Published
Copyright © 2025 Bernard Otchere, et al.
 This is an open-access article distributed under the terms of the Creative Commons Attribution License, which permits unrestricted use, distribution, and reproduction in any medium, provided the original author and source are credited.
Corresponding author: Bernard Otchere, Regional Centre for Energy and Environmental Sustainability, University of Energy and Natural Resources, Sunyani, Ghana, Department of Civil and Environmental Engineering, University of Energy and Natural Resources, Sunyani, Ghana —
Competing Interests
The authors have declared that no competing interests exist.
Funding
No specific funding statement was provided by the authors.
Data Availability
No data-availability statement was provided by the authors.
Acknowledgements
The authors thank the technicians at the Chemical / Biological Laboratory of the University of Energy and Natural Resources for their support during the laboratory analysis.
Citation:
Introduction
Water is one of the most important natural resources known on earth. It is an essential part of human nutrition, either directly as drinking water or indirectly as a constituent of food. It is also a key parameter influencing the survival and growth of microorganisms in food and other microbial environments 1. Potable water is essential, and its quality can be assessed through various indicators, including the health of ecosystems, human interaction, and the characteristics of local geology. Healthy ecosystems contribute to water quality by acting as natural filters, absorbing pollutants, and maintaining ecological balance. Human contact with water bodies serves as an indicator of potential contamination sources, such as industrial runoff or agricultural activities, which may affect water safety. Moreover, local geology influences water composition, with factors like soil permeability and rock types determining groundwater quality and vulnerability to contamination 2.
The United Nations (UN) and other countries declared access to safe drinking water as a fundamental human right, and an essential step towards improving living standards. Access to potable water was one of the main goals of the Millennium Development Goals (UN-MDGs) and a key to ensuring Sustainable Development Goal 6 which states that "Water sustains life, but safe clean drinking water defines civilization"3. According to UNICEF, about 785 million people around the world live without improved drinking water (UNICEF, Drinking water, 2019). About 80% of urban dwellers have access to piped drinking water and 96% have access to improved drinking water sources. However, often the bacteriological quality of this water remains poor; more than 50% of urban residents in developing countries are still affected at one time or another by diseases related to insufficient access to safe drinking water and improved sanitation (WHO, 2020) . This situation is even worse in rural areas where majority lacks basic access to clean water and sanitation 6, 7.
In Ghana, sachet water businesses have seen rapid growth, becoming established as a trusted drinking water source 8. Drinking water is obtained from various sources depending on local availability, including surface water (such as rivers, lakes, reservoirs, and ponds), groundwater (aquifers), and rainwater 9. Sachet water sourced from deep groundwater is renowned for its cleanliness due to natural purification processes. However, debates arise regarding this notion, as human activities and efforts to access aquifers become factors 10. Activities like agriculture and industry, carried out on the land's surface, can introduce pollutants into water sources 11.However, even if no sources of anthropogenic contamination exist, there is the potential for natural levels of minerals and other chemicals to be harmful to human health 12.
The increasing population in Fiapre, coupled with the inconsistent water supply from the Ghana Water Company Limited (GWCL), has compelled a significant portion of residents to rely on groundwater as an alternative water source 13. Yet, many residents use these sources of water unaware of the quality of the water and its potential health implications. Those who cannot afford the cost of drilling rope pump well tend to buy water from those who have it and also resort to boreholes. In accordance with WHO standards, the utilization of septic tanks is discouraged in regions where high-water tables prevail or where groundwater serves as the predominant source of potable water. Similarly, caution is advised in deploying septic tanks in areas characterized by soils with limited permeability 14. This is because the seeping of septic tank effluent into the groundwater may cause diseases such as cholera when the water is used for drinking purposes 15. Existing literature is limited in evaluating the quality of drinking water sources in Fiapre at both public and household level. Therefore, this study aims to assess the drinking water quality of selected households and public drinking water sources in the Fiapre. The study specifically seeks to evaluate some physicochemical parameters (pH, electrical conductivity (µS/cm), TDS (mg/l), Temperature (oC), Chloride (mg/l), NH3- N (mg/l), NO3- N (mg/l), NO2- N (mg/l), PO43- (mg/l) and microbial parameters (total coliforms, fecal coliforms, and E. coli) of selected drinking water pollution by assess its WAWQI and assess the possible risk factors associated with the contamination.
Materials and Methods
Description of the study area
The Sunyani West District (Figure 1) is one of the 260 Metropolitan, Municipal, and District Assemblies (MMDAs) in Ghana, and forms part of the 12 Municipalities and Districts in the Bono Region with Odomase as the administrative capital. Geographically, the District lies between 7º 19´N and 7º 35´N and 2º 08´ W and 2º 31´ W. The population of the District according to the Ghana Statistical Service stands at 108,03116. According to the 2020 census, 1,208,649 people are living in the Bono Region, with a 2.2% annual population growth rate. According to the 2020 Census, 915,972 people are living in the GWCL's service areas, and 52% of them are believed to have access to water. There is a massive demand gap of 40,292 m3 per day, or a negative difference of 26.7%, between the installed daily production capacity of 20,749 m3 and the current average daily output target of 14,678 m3. This data makes it very apparent why GWCL can only provide a limited amount of water to any area in the region. As a result, communities in Sunyani, like Fiapre, turn to drink water from streams and dug-out wells. Although some of these water sources seem to be clean sources of water, they might not be safe to consume 17. In Fiapre, it is a common practice to stores water in reservoirs, barrels, and tanks when the Ghana Water Company Limited (GWCL) supplies water. This stored water acts as a reserve to mitigate water shortages or scarcity situations. Again, most of these residents are unaware of the effects of contamination, primarily due to insufficient education, limited access to information, or inadequate policies regarding water quality.
Figure 1. Administrative Map of Fiapre Located in Sunyani Municipal and Various Water Sampling Points.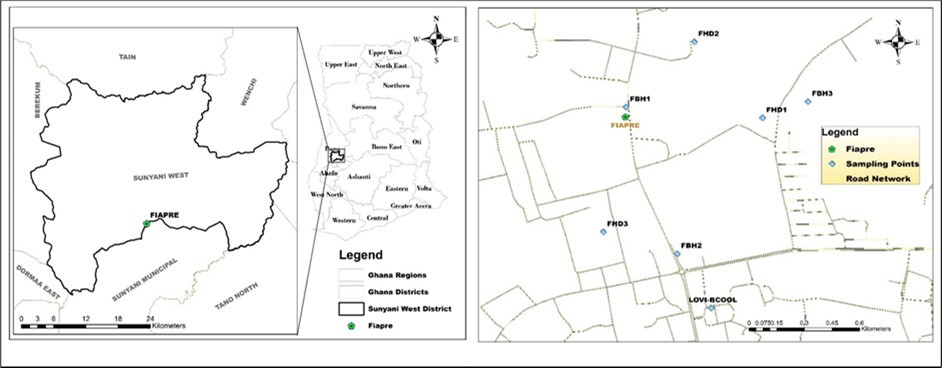
Download figure
Data Collection and Preparation
To achieve the objective of this study, a mixed-method approach (quantitative and qualitative) was employed. The quantitative technique involved the sampling of water for laboratory analysis to ascertain physicochemical parameters (pH, electrical conductivity (µS/cm), TDS (mg/l), Temperature (oC), Chloride (mg/l), NH3- N (mg/l), NO3- N (mg/l), NO2- N (mg/l), PO43- (mg/l) and microbial parameters (total coliforms, fecal coliforms, and E. coli). The significance of the selected water quality parameters is shown in Table 1. A survey using questionnaires was also administered to some residents and households in Fiapre based on their drinking water sources, water storage, types of storage containers, location of water containers, and household water treatment, Household survey was also done as part of the qualitative data collection techniques.
Water Sampling
Using the United States Environmental Protection Agency,(USEPA) standard techniques for sampling, water samples were taken from 8 different drinking water sources - three different boreholes (FBHI, FBH2 and FBH3), three different hand-dug wells (FHD1, FHD2 and FHD3), and the two most patronized brands of sachet water in the study area (See Figure 1).Specifically, a total of 48 samples were taken from the eight sampling locations or points, namely; FHD (1, 2, 3), FBH (1, 2, 3), and SWI and SW2 for Fiapre Hand dug well, Fiapre Borehole and Sachet water (C and LB sachet water sources) respectively. The samples were taken early in the morning around 8 am and at weekly intervals for months (March and May 2020). According to USEPA (2013), sampling water in the morning minimizes system disturbance, accounts for sedimentation, stabilizes temperature variability, and adheres to guidelines for consistency and comparability, ultimately ensuring accurate assessment and regulatory compliance. A 500ml plastic bottles were used to collect the water samples. In-situ parameters pH, Temperature, and Electrical conductivity were measured onsite. After sampling, all samples were sealed, labeled (showing sample type, location, identity number, date and time), and stored over ice in a thermo- insulated container to maintain the samples at a temperature below 4oC prior to their transportation to the Chemical Science Laboratory of the University of Energy and Natural Resources within approximately half an hour (WHO, for analysis. ArcGIS was also used to delineate the study site and sampling points
Determination of Physicochemical and Microbiological quality of drinking water
Water samples were analyzed for pH, electrical conductivity (µS/cm), TDS (mg/l), Temperature (oC), Chloride (mg/l), NH3- N (mg/l), NO3- N (mg/l), NO2- N (mg/l), PO43- (mg/l), total coliforms, fecal coliforms, and E. coli. Table 1 presents the list of parameters and the methods used to determine their concentrations.
Table 1. Laboratory analysis of physicochemical and microbial parameters| Water Quality Parameter | Analytical Techniques for determination | Significance of Parameter |
| pH | pH Meter | Affects coagulation and disinfection with chlorine |
| Electrical Conductivity (μS/cm) | Conductivity Meter | Indicates the presence of dissolved substances |
| Temperature (°C) | Thermometer | Affects the taste of water |
| TDS (mg/l) | Gravimetric method | Indicates the presence of dissolved substances |
| Chloride (mg/l) | Titration Method | Indicates the sign of contamination from industrial and sewage effluents |
| Alkalinity (mg/l) | Titration Method | Is an Indicator of the relative concentrations of the ions carbonate, bicarbonate, and hydroxide and several anions. |
| Total Hardness | Titration Method | Indicates the presence of dissolved ions like Mg2+, Ca2+ |
| NH3- N (mg/l) | Spectrophotometer | Indicators of potential bacterial, sewage, and animal waste pollution include ammonium. |
| NO3- N (mg/l) | Spectrophotometer | Nitrate in groundwater raises concerns about sewage pollution or excessive fertilizer use. |
| NO2- N (mg/l) | Spectrophotometer | An intermediary in the conversion of ammonia to nitrate is nitrite. Nitrite and methemoglobinemia are related. |
| PO43- (mg/l) | Spectrophotometer | Indicates the presence and growth of algae and the generation of cyanotoxins. |
| Total coliform (CFU/100 ml) | Most Probable Number count | Indicates the presence of human pollution or activities |
| Fecal coliform (CFU/100 ml) | Most Probable Number count | Indicates the presence of fecal contamination of water |
| E. coli (E. coli//100 ml) | Most Probable Number count | Indicates the presence of fecal contamination of water |
Water Quality Index
The findings of the water quality for the various water sources were assessed with the Adapted Water Quality Index (WAWQI) 19. The Adapted Water Quality Index (WQI) was determined using the approved equation by the Ghana Resources Commission (WRC, 201) for analyzing water quality indices. The Ghana National Water Quality Index was based on the Solway River Purification Board (RPB) Weighted Water Quality Index, which was developed by Bolton et al. (1978) and adapted by WRC (2013). The index was calculated for determining water quality, using 10 factors including pH, electrical conductivity, temperature, TDS, fluoride, Chloride, NO3- N, total hardness, phosphate, and fecal coliform, which is similar to the National Sanitation Foundation Water Quality index (NSFWQI). The parameters used for this analysis is similar to the one by Noori et al. (2019) and Akosua et al., (2020). The index classifies water quality into one of five categories: Excellent (>80), good (60-80), poor (40-59), very polluted (25-39) and unsuitable for drinking (<25) (WRC, 2017: (Lermontov et al., 2009; Tyagi et al. (2013). Each category describes the state of water quality compared to objectives that usually represent the natural state. The adopted Water Quality Index was calculated from the following equation:
Water Quality Index (Weighted) 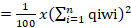
where, qi = water quality score of parameters I; wi = weighting factor of parameter i and n = number of parameters.
Sanitation Survey
A standardized inspection checklist originally developed by British Geological survey and previously used by Lutterodt et al. (2018) was adapted for risk inspection and assessment. First, we inquired about the flooring material of water sources, specifically whether they were tiled, cemented, cast, or untarred. Research by Lutterodt et al. (2018) highlights that impermeable flooring materials such as tiles and cement reduce the risk of bacterial infiltration and contamination compared to untarred surfaces, thus emphasizing the importance of this aspect in safeguarding water quality. Secondly, the study examined the proximity of water sources to septic tanks as numerous studies including 20, 21 have demonstrated the heightened risk of contamination posed by septic tanks, with closer proximity increasing the likelihood of fecal matter and pathogen infiltration into water sources, thereby emphasizing the critical need to maintain a safe distance. According to the WHO, 2020 a septic tank must be placed at least 30m away from a water source. Additionally, we observed the cleanliness of the surroundings surrounding water sources. We also assessed the presence of farming activities around water sources due the potential introduction of agricultural runoff, pesticides, and fertilizers into water sources and to ensure safe and clean water access for the communities
Data Management and Analysis
Data were processed into means and standard deviations presented in tables and graphs with their degrees of dispersions about the mean value (standard deviation) using Microsoft Excel. Descriptive and inferential statistical analysis were carried out. Significant p-value of a percentage confidence interval of 95 was applied where necessary for the analysis. The observed water quality analysis of the various water sources was compared to the WHO recommended limit for drinking purposes (WHO, 2011, 2014). Water hardness were further compared with the British Columbia Groundwater Association, (2007) category as reference (ie: Soft (<60mg/l), Medium or Moderately Hard (60mg/1-120mg/l), Hard (120mg/l) and Very Hard (>180mg/l).
Results and Discussions
Physicochemical Parameters
Physicochemical parameters including pH, temperature, electrical conductivity and total dissolved solids were analyzed and compared to the WHO standards (Table 2)
Table 2. Results of physicochemical parameters| Sources | pH | E. Conductivity(μS/cm) | Temperature (̊C) | TDS (mg/L) |
| FBH1 | 6.11 | 0.237 | 34.2 | 104 |
| FBH2 | 6.41 | 0.347 | 31.4 | 206 |
| FBH3 | 5.75 | 8.4 | 32.1 | 176 |
| FHD1 | 5.75 | 0.488 | 30.0 | 309 |
| FHD2 | 6.13 | 0.506 | 30.0 | 202 |
| FHD3 | 5.37 | 0.411 | 31.1 | 152 |
| SW1 | 5.44 | 0.481 | 30.3 | 213 |
| SW2 | 6.11 | 0.533 | 29.0 | 198 |
| WHO GUIDELINE | 6.50-8.50 | <700µS/cm | 22-29 | <1000 |
|---|
Many of the water sources had temperatures higher than the recommended range of 22 to 29 (WHO, 2011). The relatively high temperatures recorded particularly for the hand dug well and boreholes may be due to major ions from water/rock interaction from dissolved amounts of carbonates like calcite or sulphides like pyrite, as both dissolution reactions are highly exothermic 23. Nyantakyi et al., (2020) attributes high water temperature to either microbial activity or depth at which water is sampled since worm tends to float in stratified waters.
The pH values of various water samples range from 5.37-6.41. This implied that all the water samples measured were acidic and fell below the WHO recommended standard for drinking water (6.50 – 8.50). This makes the water sources not suitable for drinking purposes if pH was the only criterion for the judgment. However, according to Yeboah et al. (2022), pH cannot be used as the only indicator for potable water because other parameters hold equal significance. According to Moyo, (2015), the pH of water determines the solubility of chemical constituents such as nutrients (phosphorus, nitrogen, and carbon and biological availability. pH showed no significant difference between the water sources (P>0.05). Ouattara et al., (2013) reports that climatic conditions and chemical, biological, and microbial processes are effective in determining oxygen variation in water. Except FBHI, FBH2 and AW2 which were mildly acidic (6.11, 6.41 and 6.11 respectively), the compliance level of pH was very high. Ramos-Vázquez & Armstrong-Altrin, (2021) reported that acidic geology of an area may contribute significantly to the lower pH, below the permissible limit, as observed in the study. Phillip et al., (2020) reported the formation of weak carbonic acid which dissolves carbon dioxide to react with H2O to release hydrogen ions (H+) to lower the pH of the water.
Electrical conductivity is a measure of the ability of water to conduct an electric current and it increases with increasing ion contents in water by runoff roads 24. According to WHO standards, the EC value should not exceed 750 μS/cm 25. Comparing all the samples recorded, all the water sources fall within the recommended standard observed by WHO. Higher conductivity levels in a water sample may be due to the presence of inorganic dissolved solids such as chlorides, nitrates, sulfates, and phosphate anions (ions that carry a negative charge) or sodium, magnesium, calcium, iron, and, aluminum cations (ions that carry a positive charge) 26. This indicates that no adverse health effects or implications for the electrical conductivity of the water were expected.
Total dissolved solids are a measure of total inorganic and organic matter dissolved in water and help to determine the quality of drinking water 27. According to WHO guidelines for drinking water, the required limit for TDS is 1000 mg/l which is prescribed for drinking purposes. Values recorded for TDS in the various water samples range from 104 to 309 mg/L. All values fall within the WHO standard for drinking water. FBH1 recorded the lowest number of TDS and FHD1 recorded the highest number of TDS. There is thus an indication of freshness in all the water sampled 28. TDS values for all the water sampled were within acceptable standards for safe human consumption. A high concentration of TDS is a marker of conceivably high pollution and requires water treatment 29.
Phosphate (PO3 -4), Nitrates (NO3-), Chlorides (Cl-), Total Hardness, and Total Alkalinity
| SOURCES | Cl - mg/L | NO 3 - mg/L | NH 3 mg/L | PO 3 -4 mg/L | Total Hardness mg/L | Alkalinity mg/L |
| FBH1 | 42.54 | 0.0449 | 0.0053 | 0.0691 | 38 | 20 |
| FBH2 | 99.26 | 0.0178 | 0.0027 | 0.0047 | 52 | 20 |
| FBH3 | 70.9 | 0.0346 | 0.0002 | 0.012 | 66 | 20 |
| FHD2 | 70.91 | 0.4558 | 0.0062 | 0.0058 | 60 | 20 |
| FHD1 | 106.35 | 0.0249 | 0.0044 | 0.0338 | 88 | 20 |
| FHD3 | 42.54 | 1.1565 | 0.0273 | 0.153 | 22 | 40 |
| SW1 | 70.9 | 0.2185 | 0.0106 | 0.0031 | 6 | 20 |
| SW2 | 42.54 | 1.2492 | 0.0032 | 0.0007 | 16 | 20 |
| WHO GUIDELINES | < 250 | 5 | 0.02 | 0.1 | < 300 | < 200 |
|---|
Regarding water hardness, the values obtained from all the sources fall within the WHO standard of drinking water. The values range from 6 to 88mg/l as expressed in calcium carbonates thus the water sources are moderately hard. The lowest hardness value recorded was SW1 sachet water, 6mg/l, and the Highest Hardness value was FHD1, 88mg/l using the British Columbia Groundwater Association, (2007) as reference (ie: Soft (<60mg/l), Medium or Moderately Hard (60mg/1-120mg/l), Hard (120mg/l) and Very Hard (>180mg/l). Water hardness is a result of the presence of calcium and magnesium ions, and sometimes other divalent metal cations like Iron (II)) existing in the water. Values recorded for alkalinity in the various water samples met the WHO standard of Alkalinity for drinking water, 20-200mg/L. Values were between 20-40 mg/L. 20mg/L repeated itself for all the samples except for FHD3, 40mg/L. (Table 3)
The WHO allows a maximum permissible limit of nitrate 5 mg/l in drinking water 25. The values of nitrates were within the required WHO standard of drinking water. Values were very minimal, with SW2 having the highest value (1.2492mg/L), and FHD2 having the lowest value. Traces of ammonia were recorded in the various water samples but were very minimal with the lowest value of 0.0002mg/L in FBH3 and the highest value of 0.0273mg/L. The traces of ammonia and nitrates could be a result of farming activities which may involve the use of fertilizers containing chemicals like nitrates near water sources (FBH3). Increased nitrate levels in drinking water can affect the water quality, which may suggest the presence of possible contaminants such as pathogens from inorganic and organic compounds, which could impair the health status of an organism. The nitrate level in the drinking water is critical with newborn children, on account of their high intake of water regarding body weight. However, all the values recorded were within the range of the WHO standard for drinking water.
Microbial Parameters
The WHO Guidelines for Drinking Water Quality recommend that all water intended for drinking should not be detected for fecal contamination in any 100 ml sample. The microbial parameters analyzed in this study were total coliform (TC), fecal coliform (FC) and E. Coli. However, traces of fecal coliforms were recorded in FBH2, FHD2, and FHD3. FHD2 recorded the highest value of fecal coliforms at 340 CFU/100ml. All the water sources have traces of total coliforms except for FBH1. The highest value of total coliforms was recorded in FHD2 30. Some residents (FHB2, FHD1, and FHD3) had their septic tanks constructed close to their source of drinking water which may be the cause of fecal coliforms present in the drinking water. This represents 0% compliance for water sample FBH2, FHD2 and FHD3 and is a public health concern in this community and people that consumed these water sources. Prolonged water storage in sunlight beyond one week before drinking should be discouraged because it causes an increase in bacteria count 31. SW2 was seen stored in cages exposed to sunlight for more than a week which may be the cause of the bacteria count in the water 15, 32. Tekpor et al. (2017) reported similar findings of high levels of bacteriological contamination of dug wells and boreholes at Atebubu in Ghana whilst Boamah et al., (2011) stated that location of dug wells, boreholes and unsanitary features poses greater influence on contamination levels compared with the WHO standard. This may be due to the sitting of water sources in proximity to septic systems and unsanitary conditions which might have rendered the wells susceptible to microbial contamination. McGill et al., (2019) indicated that soakage pits and pit latrines can extend their influence on ground-water quality up to 10 m or more as groundwater flow is either lateral or vertical. Even though the presence of coliforms is a source of worry, Rankinen et al. (2016); Sacks & Bernstein, (2011) and Xue et al., (2018) reported that total coliform bacteria are widely found in nature and do not necessarily indicate fecal pollution (Table 4).
Table 4. Fecal and total coliform levels in water samples in Fiapre.| SOURCES | Total Coliform | Fecal Coliform | E. Coli |
| FBH1 | 0 | 0 | 0 |
| FBH2 | 80 | 18 | 0 |
| FBH3 | 13 | 0 | 0 |
| FHD2 | 1220 | 340 | 0 |
| FHD1 | 53 | 0 | 0 |
| FHD3 | 103 | 47 | 0 |
| SW1 | 53 | 0 | 0 |
| SW2 | 3 | 0 | 0 |
| WHO GUIDELINES | 500 | 0 | 0 |
|---|
Evaluation of water quality with the use of WQI
The water quality index is used to show the degree to which water source quality is impacted by anthropogenic activities. The current study determined the WQI for various water sources (Table 5). A detailed estimation of the various WQI for the respective water sources are shown in the supplementary sheet (Table A1). The findings show that FBH3 and FHD2 could be classify as excellent, FBH1, FBH2, SW1, and SW2 could be classified as good whiles water sources from FHD1 and FHD3 could be termed as poor for drinking 33.
Table 5. Indicators calculating WQI for the various water sources| Parameters | FBH1 | FBH2 | FBH3 | FHD1 | FHD2 | FHD3 | SW1 | SW2 |
|---|---|---|---|---|---|---|---|---|
| pH | 6.11 | 6.41 | 5.75 | 5.75 | 6.13 | 5.37 | 5.44 | 6.11 |
| E. Cond. | 0.237 | 0.347 | 8.4 | 0.488 | 0.506 | 0.411 | 0.481 | 0.533 |
| Temperature | 34 | 31 | 32 | 30 | 30 | 31 | 30 | 29 |
| TDS | 104 | 206 | 176 | 309 | 202 | 152 | 213 | 198 |
| Phosphate | 0.0691 | 0.0047 | 0.012 | 0.0058 | 0.0338 | 0.153 | -0.0031 | -0.0007 |
| Chloride | 42.54 | 99.26 | 70.9 | 70.91 | 106.35 | 42.54 | 70.9 | 42.54 |
| Total Hardness | 38 | 52 | 66 | 60 | 88 | 22 | 6 | 16 |
| Nitrate | 0.0449 | 0.0178 | 0.0346 | 0.4558 | 0.0249 | 1.1565 | 0.2185 | 1.2492 |
| Alkalinity | 20 | 20 | 20 | 20 | 20 | 20 | 20 | 20 |
| Faecal Coliform | 0 | 18 | 0 | 340 | 0 | 47 | 0 | 0 |
| WQI | 61.75 | 63.24 | 87.84 | 56.41 | 80.94 | 54.81 | 74.38 | 76.84 |
Abdul-Razak et al. (2010) and Phillip et al., (2020) have all reported that even though single-factor methods (for example the major parameter that influence water quality) provide valuable information, multiple parameters can benefit water quality evaluation, and such methods have been increasingly adopted in various studies. Duncan, (2020) recently showed that water level is an important parameter regulating the structure and function of natural lake ecosystems. This may be one of the reasons why most of the samples recorded either excellent or good water quality status. WQI has proved to be a good tool for assessing the quality of our rivers globally. The application of a water quality index allowed a water quality classification within the water sources using uniform, objective criteria and can be applied in water sources in Ghana. Fecal coliform, pH, and phosphate were the major parameters responsible for the differences in WQI scores in the waters in the respective drinking water sources Figure 2.
Figure 2. Contribution of each water indicator parameter on calculated WAWQI with various water sources.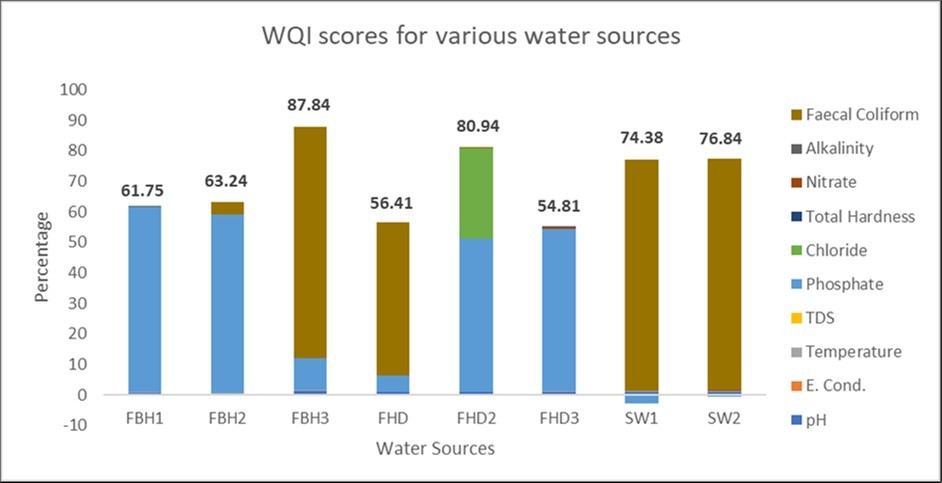
Download figure
Results from the survey questionnaires.
Respondent’s general access to drinking water sources and possible risks of contamination
Regarding sources of water used for drinking, 43.3% use sachet water, 26.7% drink from boreholes, 23.3% drink from Hand-dug wells, and 10% drink from GWCL. However, with regards to sources of water for domestic and other purposes, 13.3% of our respondents use sachet water, 20% use boreholes, 40% use Hand-dug wells, and 26.7% use water from GWCL (Table 6). This confirms that a significant number of people in the community are subjected to contracting water-borne diseases, as the majority use untreated sources such as the hand-dug well (23.3%) of drinking water since high amounts of total and fecal coliforms were present in the hand dug wells, specifically FHD1 and FHD3.
Table 6. Respondent’s access to drinking water sources and possible risks of contamination| Variable | Frequency (N = 30) | Percentage % |
|---|---|---|
| Drinking water source | ||
| Sachet | 13 | 43.3 |
| Borehole | 8 | 26.7 |
| Hand-dug | 7 | 23.3 |
| Pipe (GWCL) | 3 | 10 |
| Sources of water for domestic purposes | ||
| Sachet | 4 | 13.3 |
| Bore Hole | 6 | 20 |
| Hand-dug well | 12 | 40 |
| Pipe (GWCL) | 8 | 26.7 |
| Household drinking water treatment | ||
| Yes | 8 | 26.7 |
| No | 22 | 73.3 |
| The water treatment method used by respondents | ||
| Boiling | 4 | 56.2 |
| Disinfection | 2 | 28.6 |
| Filtration | 1 | 14.3 |
| Respondent’s Reasons for not treating drinking water (N=20) | ||
| Treatment is expensive | 3 | 18.18 |
| Drinking water is already save | 4 | 22.7 |
| I don’t believe I can be harm | 7 | 31.8 |
| It’s not important | 6 | 27.27 |
| Household drinking water storage facility | ||
| Refrigerators | 17 | 56.7 |
| Barrel | 5 | 16.7 |
| Jerry can | 6 | 20 |
| Clay Pot | 2 | 6.7 |
| Access to drinking water storage containers | ||
| Everyone | 26 | 86.7 |
| Adults only | 4 | 13.3 |
| Drinking water storage container Locations | ||
| Bedrooms | 15 | 50 |
| Kitchens | 7 | 23.3 |
| Corridors | 5 | 16.7 |
| Outside the compound | 3 | 10 |
| Regular hand washing practices by respondents | ||
| Yes | 17 | 56.7 |
| No | 13 | 43.3 |
According to UNICEF, seventy percent (70%) of households in Ghana drink water that is contaminated with fecal matter. Moreover, only four percent of households in Ghana treat their water suitably before drinking and ninety-three percent (93%) of households do not treat water at all. In Fiapre, 26.7% of the respondents treat their drinking water and 73.3% (Twenty-two) of our respondents do not treat their source of drinking water. 2% of the respondents stated that they treated their water regularly, 25% also indicated that they treat their water sometimes and 50% indicated that they treat their source of drinking water once in a while. Moreover, 62.5% of the eight respondents treat their water by boiling, 25% treat their water by disinfecting, and the remaining 12.5% practice filtration. The twenty-two respondents who do not treat their source of drinking water had their reasons.18.8% indicated that treatment is expensive. 22.7% indicated that they believe their drinking water is safe for drinking, 31.8% also believe they can’t be harmed by the water and 27.27% think it is not important to treat their drinking water.
The human hand has continual contact with the environment every day and has been identified as one of the richest habitats for human microbial accommodation thus, making hand hygiene a possible risk factor associated with drinking water contamination. It is believed that most people do not wash their hands even when the activity they engage in warrants so or demands so. In the current study, 56.7% of household respondents indicated that they practice the habit of washing hands before accessing their source of drinking water. On the other hand, 43.3% indicated that don’t practice the habit of washing their hands or ensuring clean hands before accessing their source of drinking water.
Rural households in developing countries rely on communal water supplies and household water frequently becomes contaminated following its collection, transportation, and during its storage. Studies have shown that storing water leads to a deterioration of water quality because of recontamination in the home. Factors that could increase contamination of stored water include the method used to obtain water from the container 32. Regarding storage of water in Fiapre, 56.7% store their drinking in bottles and refrigerate them. 16.7% store their drinking water in barrels, 20% store them in jerry cans, and 6.7% store them in clay pots. The wide-mouthed container for the study is defined as barrels, jerry cans, clay pots, or tubs where anyone can have direct access to the stored water in the vessel. Recontamination of drinking water in the home is significant in the water quality surveys. Recontamination can either be ‘domestic domain’ transmission corresponding to in-house contamination, or ‘public domain’ transfer that corresponds to pollution directly at the water source. The domestic domain does occur from the size of the storage vessel mouth, transfer of water between containers from collection to storage, hand-to-water contact, and dipping of utensils. Large-mouthed containers have significantly higher odds of recontamination than small-mouthed containers 34. None of our respondents store their drinking water in drums and reservoirs.
Furthermore, Some Fiapre residents have choices of storage containers in terms of domestic and other purposes. None of the respondent’s store water for domestic purposes in refrigerators. 16.7% of our respondents store their water in barrels, and 23.3% indicated jerry cans as storage containers for domestic and other purposes. None of the respondents indicated clay pots for water intended for domestic purposes. Twelve (40%) indicated drums as containers for storage intended for domestic and other purposes. Six (20%) have reservoirs designated for domestic purposes. With regards to who has access to drinking water, twenty-four (80%) of the selected households allow everyone in the household access to their storage containers for drinking without restrictions. Six (20%) allow adults only to access containers storing drinking water. Moreover, some residents in Fiapre have different preferences regarding where to keep storage containers for drinking water. Fifteen (50%) of selected households keep the containers in the bedroom, and seven (23.3%) prefer to keep their storage containers for drinking and domestic uses in the kitchen. Eight (16.7%) also keep their storage containers designated for domestic purposes in corridors. Three (10%) of selected households keep their storage designated for only domestic purposes outside.
Conclusion
The study assessed the levels and evaluated possible risk factors of contamination of physicochemical and microbiological parameters of drinking water in Fiapre. The physicochemical characteristics revealed that the sources of drinking water in the study community are acidic and above the recommended WHO values whereas electrical conductivity and other parameters were within the WHO range. Most of the parameters such as water pH, Phosphate, total and faecal coliform were not within the regulatory safe limit. Values for Total coliforms for all the water samples did not meet the required WHO standard for drinking water except FBH1. Similarly, values for Faecal coliforms did not meet the WHO standard for drinking water. Bacteria counts in SW1 may be due to its exposure to sunlight for a very long time. The water treatment behaviors and practices of the Fiapre community are very poor. Thus, some residents of Fiapre who drink from boreholes and hand-dug wells, without treatment are prone to fecal contamination and bacterial infections. The results of this study proved that the water quality within the Fiapre basin is generally classified in the excellent, good and poor class with the highest WQI value recorded for FBH3, 87.84% and the lowest recorded for FHD3, 54.81% Irregular handwashing practices, untidy surroundings of the water source, and lack of drinking. The study recommends that residents of Fiapre should be educated on water treatment and behaviors like regular washing of hands, tidy surroundings, proper siting of the septic tank not too close to the source of drinking water, and its relevance to their health.
References
- 2.WRC. (2013) Ghana Raw Water Quality Criteria and Guidelines, Adapted Weighted Raw Water Quality Index Application to Ghanaian River Systems. , Accra
- 4.Abdul-Razak A, A B, Entsua-Mensah R E M, deGraft-Johnson K A A. (2010) Assessment of the water quality of the Oti river in Ghana. , West African Journal of Applied Ecology 16, 10-4314.
- 6.Ahmed J, L P Wong, Y P Chua, Channa N, R B Mahar et al. (2020) Quantitative microbial risk assessment of drinking water quality to predict the risk of waterborne diseases in primary-school children. , International Journal of Environmental Research and Public Health 17(8), 10-3390.
- 7.Akosua R, Gyimah A, Gyamfi C, G K Anornu, A Y Karikari et al. (2020) . , Multivariate Statistical Analysis of Water Quality of the Densu River, Ghana. International Journal of River Basin Management 0(0), 1-27.
- 8.D A Amatobi, J C Agunwamba. (2022) Improved quantitative microbial risk assessment (QMRA) for drinking water sources in developing countries. , Applied Water Science 12(3), 10-1007.
- 9.Association American Public Health, A. (2005) Standard Methods for the Examination of Water and Wastewater. , Washington, DC
- 11.Augustine I Airaodion, o D. (2019) Assessment of Sachet and Bottled Water Quality in. , Global Journal of Nutrition and Food Science 2.
- 13.N O Boadi, S A, Baa-Poku F, E A Mensah, Addo M. (2020) Safety of borehole water as an alternative drinking water source. , Scientific African 10, 00657-10.
- 14.V E Boamah, S Y Gbedema, Adu F, Ofori-Kwakye K. (2011) Microbial quality of household water sources and incidence of Diarrhoea in three Peri-Urban communities in Kumasi. , Ghana. Journal of Pharmaceutical Sciences and Research 3(3).
- 15.P W Bolton, J C Currie, D J Tervet, W T. (1978) An index to improve water quality classification. , Wat. Pollut. Control 6, 271-285.
- 16.I J Chinenye, O. (2017) . Effect of Storage and Exposure to Sunlight on the Quality of Sachet Water Sold Effect of Storage and Exposure to Sunlight on the Quality of Sachet Water Sold in , Ibadan Metropolis .
- 17.E S Dadzie. (2012) Assessment of Heavy Metal Contamination of the Densu. , KWAME NKRUMAH UNIVERSITY OF SCIENCE AND TECHNOLOGY
- 20.A E Duncan. (2020) The Dangerous Couple: Illegal Mining and Water Pollution - A Case Study in Fena River in the Ashanti Region of Ghana. https://doi.org/10.1155/2020/2378560 , Journal of Chemistry
- 23.Francis A, Andrews N, A K Francis. (2019) Shared household septic tank: A case study of Fiapre in the Brong Ahafo Region of Ghana. , African Journal of Environmental Science and Technology 13(3), 126-134.
- 25.S F Gyasi, Abdul-Rashid H, Boakye T, Abugre R, H K Korda. (2017) . Microbial Contamination of Hand Dug Wells and Pit Latrines in Fiapre in the Sunyani , Ghana, Jenrm 4(1), 85-92.
- 26.G B Hagan, Minkah R, Yiran G A B, Dankyi E. (2022) Assessing groundwater quality in peri-urban Accra, Ghana: Implications for drinking and irrigation purposes. Groundwater for Sustainable Development. 17, 100761-10.
- 27.Henry Addo Ofosu. (2018) Microbial Quality of Household Drinking Water in the Sunyani Municipality of Ghana. , Journal of Environment and Earth Science 04.
- 28.Khouni I, Louhichi G, Ghrabi A. (2021) Use of GIS based Inverse Distance Weighted interpolation to assess surface water quality:. , Case of Wadi El Bey, Tunisia. Environmental Technology and Innovation 24, 101892-10.
- 29.Kwame Mensah Mawuli. Ghana. Kwame Nkrumah University of Science and Technology, Department of Theoretical and Applied Biology (2011) Assessment of Drinking Water Quality in Ehi Community in The Ketu-North District of the Volta Region of.
- 30.Lutterodt G, Vossenberg J van de, Hoiting Y, S Kamara A Oduro- Kwarteng, JWA Foppen. (2018) Microbial Groundwater Quality Status of Hand-Dug Wells and Boreholes in the Dodowa Area of Ghana. , International Journal of Environmental Research and Public Health 15(4), 730.
- 31.Mosi Lydia. (2018) Microbiological assessment of sachet water "pure water" from five regions in Ghana. , AAS Open Research
- 32.B M McGill, Altchenko Y, S K Hamilton, P K Kenabatho, S R et al. (2019) Complex interactions between climate change, sanitation, and groundwater quality: a case study from. , Ramotswa, Botswana, Hydrogeology Journal 27(3), 10-1007.
- 33.Meybeck M, Kuusisto E, Mäkelä A, Mälkki E. (1996) Water Quality Monitoring (Chapter 2) - A Practical Guide to the Design and Implementation of Freshwater Quality Studies and Monitoring Programmes.
- 36.Oram Brian, P. (2014) Hard water, Hardness, Calcium Magnesium, Water corrosion mineral scale. Water Research Center.
- 37.J A Nyantakyi, Fei-baffoe B, Akoto O. (2020) . Seasonal Variations in Physicochemical and Nutrient Water Quality of River Tano in Ghana 4(1), 1-12.
- 38.Sakyi O, K Bienibuor P, A, Akuamoah K, R. (2021) Assessing the Physicochemical Parameters of Water Sources in the Fiapre Vicinity, a Suburb of Sunyani in the Brong Ahafo Region of Ghana. , International Journal of Advances in Scientific Research and Engineering 4(9), 153-163.
- 39.Obiri-Yeboah A, E K Nyantakyi, A R Mohammed, Yeboah S I I K, M K Domfeh et al. (2021) Assessing potential health effect of lead and mercury and the impact of illegal mining activities in the Bonsa river. , Tarkwa Nsuaem, Ghana, Scientific African 13, 00876-10.
- 40.N K Ouattara, A de Brauwere, Billen G, Servais P. (2013) Modelling faecal contamination in the Scheldt drainage network. , Journal of Marine Systems 128, 77-88.
- 41.Phillip A-G, A L John, G A Matthew. (2020) Water quality index (WQI) and bacteriological assessment of some selected hand-dug wells in the Adenta municipality. , Ghana. African Journal of Microbiology Research 14(8), 402-409.
- 42.Rahmanian. (2015) Analysis of Physiochemical Parameters to Evaluate the Drinking Water Quality in the State of Perak. , Journal of Chemistry 10.
- 43.M A Ramos-Vázquez, J S Armstrong-Altrin. (2021) Provenance of sediments from Barra del Tordo and Tesoro beaches, Tamaulipas State, northwestern Gulf of Mexico. , Journal of Palaeogeography 10(1), 10-1186.
- 44.Rankinen K, Butterfield D, Sànchez Faneca, Grizzetti M, Whitehead B et al. (2016) The INCA-Pathogens model: An application to the Loimijoki River basin in Finland. , Science of the Total Environment 572, 1611-1621.
- 45.Roy Ritabrata. National Institute of Technology Agartala, Department of Civil Engineering (2019) An Introduction to Water Quality Analysis. Retrieved from www.irjet.net , Barjala, Jirania, Tripura
- 46.S D Richardson, C. (2016) Comprehensive Analytical Chemistry. Science Direct. Retrieved from science.
- 47.Sacks M, Bernstein N. (2011) Utilization of reclaimed wastewater for irrigation of field-grown melons by surface and subsurface drip irrigation. , Israel Journal of Plant Sciences 59(2), 159-169.
- 48.M U Sheshe, A M Magashi. (2014) Assessment of physicochemical quality of sachet water. , Bayero Journal of Pure and Applied Science
- 49.UNEPWHO. (1996) A Practical Guide to the Design and Implementation of Freshwater Quality Studies and Monitoring Programmes. , (J. B. Ballance, Ed.) Water Quality Monitoring
- 50.UNICEF. (2010) UNICEF works to ensure that every child has access to safe drinking water. Water, Sanitation, and Hygiene.
- 51.Vandergrift R. (2017) Reconciling hygiene with a modern microbial perspective. Cleanliness in context.
- 52.Water Quality Association. (2020) Water Quality Association, Scale Deposits. Retrieved from wqa.org.
- 53.World Health Organization. (2017) Guidelines for drinking water quality. Water Sanitation and Hygiene, IV 631.
- 54.World Health Organization. (2020) Unsafe drinking water, sanitation, and waste management. Health and sustainable development.
- 55.Xue F, Tang J, Dong Z, Shen D, Liu H et al. (2018) Tempo-spatial controls of total coliform and E. coli contamination in a subtropical hilly agricultural catchment. , Agricultural Water Management 200, 10-1016.