
Visualization of Myocardial Damage Based on Surface Heart Model
- Open Access
- Peer Reviewed
- Similarity Checked
- CC BY 4.0
Abstract
The visual presentation of the results of the analysis of cardio graphic information is an important element of the diagnostic process. The article discusses the issues of visualization of the state of the heart, notes the importance of a visual representation of the processes of the functioning of the heart for diagnosis. The Delaunay triangulation is considered and it is proved that on its basis it is possible to approximate an arbitrarily complex surface. An algorithm for constructing a surface model of the heart based on Delaunay triangulation has been developed. The issues of texture generation are covered in detail. The texture is a convenient tool for displaying the state ofthe heart, as it allows you to visually show the place of possible damage on the surface of the heart.
Article Information
- Received
- Accepted
- Published
Copyright © 2023 Satybaldiyeva F. A., et al.
 This is an open-access article distributed under the terms of the Creative Commons Attribution License, which permits unrestricted use, distribution, and reproduction in any medium, provided the original author and source are credited.
Corresponding author: Correspondence: Oleg Bodin, Baydukov Passage / Gagarina Street 1a/11, Penza 2440026, Russia —
Competing Interests
The authors have declared that no competing interests exist.
Funding
No specific funding statement was provided by the authors.
Data Availability
No data-availability statement was provided by the authors.
Citation:
Formulation of the Problem
One of the most important aspects of using a computer in functional diagnostics to improve efficiency is the ability to visualize the state of the heart. The heart is a three-dimensional organ, therefore, for a realistic representation of the heart functioning process, it is necessary, based on the analysis of cardio graphic information, to synthesize a truly spatial model of the electrical activity of the heart with the construction of a three-dimensional image of the heart, with the propagation of an excitation wave along the surface of the heart, with the localization of the site of heart damage. The solution to this problem will improve the clarity of the diagnosis, eliminate gross errors, and ensure the correct therapeutic process. A number of medical computer systems are known 1, 2, which, based on the analysis of cardio graphic information, provide the ability to visualize the state of the CVS (Cardiovascular System), but their use does not go beyond educational and research laboratories, as well as large clinics. At the same time, scientists especially emphasize the complexity of modeling and visualization of the state of the heart: “a heart simulator requires large computing power, so that even when using powerful computers, it takes a day to simulate a second of the heart's work” 1.
Modern means of functional diagnostics do not provide the ability to view state of CVS on a realistic pattern of the patient's heart on an ambulatory basis 3, 4, 5.
The concerns with visualization of heart condition is the observable presentation of a realistic image of the patient's heart model to the user of a computer diagnostic system, is practically not covered. With ambiguity in ECG interpretation and a low level of visualization, the results obtained reduce the effectiveness of electrocardiogram. The aim of the article is to develop a method for visualizing myocardial damage based on a surface model of the heart.
Materials and Methods
Delaunay Triangulation
Delaunay triangulation is the simplest method for approximating a complex surface, due to which it is widely used in computer graphics and geographic information systems for surface modeling and solving spatial problems. Triangulation satisfies the Delaunay condition if none of the given triangulation points 6 falls into the circle circumscribed around any constructed triangle (Figure 1).
Checking the Delaunay condition is one of the most important operations performed when constructing a triangulation. In practice, several verification methods are used, for example, checking the sum of opposite angles. Its meaning is as follows (for simplicity, the case of two-dimensional triangulation is given (Figure 2) the Delaunay condition for a triangle (P1 (x1, y1), P2 (x2, y2), P3 (x3, y3)) will be satisfied if and only then, when for any other point Р0 (x0, y0) the triangulation will be:
Figure 1. The Delaunay triangulation condition 
Download figure
Figure 2. Illustration of checking the Delaunay triangulation condition 
Download figure

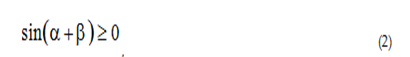

where α- angle Р1Р2Р3, and β - angle Р1Р0Р3.
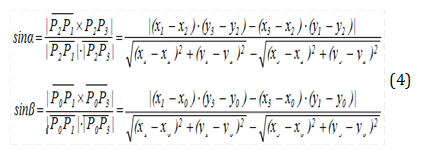
where P0,Р1,Р2,Р3 – points, (x0,y0) (x1,y1) (x2,y2) (x3,y3) – coordinates in two-dimensional space of points P0,Р1,Р2,Р3 respectively.
The values cosα and cosβ can be calculated using the vector dot product formula 7:

where P0,Р1,Р2,Р3 – points, (x0,y0) (x1,y1) (x2,y2) (x3,y3) – coordinates in three-dimensional space of points P0,Р1,Р2,Р3 respectively.
Substituting expressions (4) and (5) into in equality (3) and reducing the denominators of the fractions, we obtain the formula for checking the Delaunay condition:
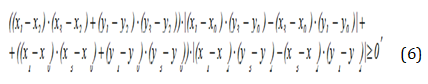
where (x0,y0) (x1,y1) (x2,y2) (x3,y3) – coordinates in three-dimensional space of points P0,Р1,Р2,Р3 respectively.
As a result, to check the Delaunay condition, 10 multiplication operations and 13 addition and subtraction operations are required.
Iterative and other similar algorithms are based on the sequential addition of points to a triangulation. First, three points are selected and combined into a triangle, and then new points are sequentially added and the triangulation is rebuilt until all available points have been processed. In this case, the following cases are considered:
1. the new point falls outside the triangulation, then new triangles are attached;
2. the new point falls inside the triangulation, in this case the point is analyzed
whether the point hits the vertex (in this case, the point is ignored), the edge (then this point becomes a new vertex and new edges are built), or inside the triangle (then this triangle is split into new triangles). When implementing these actions, the Delaunay condition may be violated, therefore, each transformation is accompanied by a verification of this condition using formula (5.8). If the condition is violated, a pair of adjacent triangles is rebuilt in such a way that the Delaunay condition is satisfied 6. It is proved that in this way it is possible to approximate an arbitrarily complex surface, and the quality will directly depend on the number of approximating triangles, i.e. with an increase in the number of triangles, any given accuracy can be

achieved 6. Figure 3 shows a wireframe model of the heart surface area (heart ventricles), built on the basis of Delaunay triangulation and consisting of an array of approximating triangles.
Figure 3. Model of the heart surface area, built on the basis of Delaunay triangulation 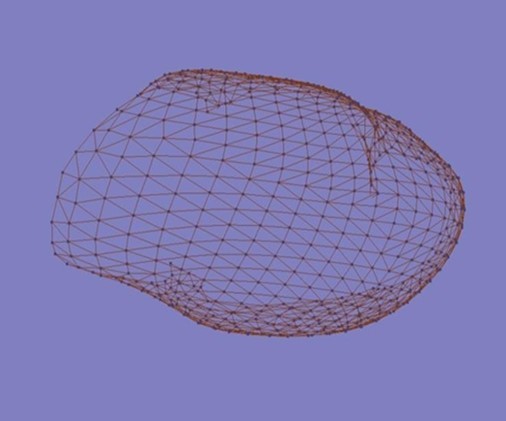
Download figure
This representation of an object is called flat-sided or, in a broader sense, boundary. At the same time, to describe curved surfaces, the planar representation can approximate them with a number of triangular or quadrangular plates.
This surface representation can be used to obtain a voxel representation of the heart surface. The surface of the heart consists of n triangles, and is described by n equations of the planes of these approximating triangles. The matrix notation of the equation of the plane passing through three points (the vertices of the triangle) is as follows 8:
where (x1,y1,z1) (x2,y2,z2) (x3,y3,z3) – the coordinates of triangle vertices, (x,y,z) – coordinates of an arbitrary point.
Replacing the point coordinates instead of x, y, z into equation (7) and calculating the determinant, it is possible to determine whether the point lies on the plane of the approximating tri angle, is on the outer side of the plane of the approximating triangle, or on the inner (if the result is greater or less than zero, respectively). The value of the determinant on the left side of equation (7) is a criterion for the belonging of a point in space to a plane. This criterion is used when checking the boundary condition. Suppose you have a cube with vertices P1..P8 representing a voxel or an octal tree node and a triangle T1T2T3 (Figure 4). It is required to determine the presence of the intersection of these objects.
Figure 4. Representation of voxel-plane intersection when checking a boundary condition 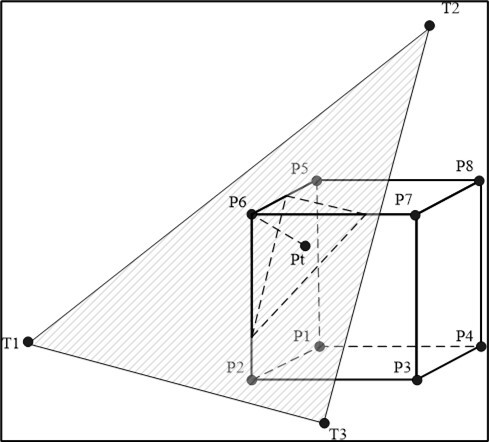
Download figure
First of all, it is necessary to check whether the vertices of the triangle T1T2T3 fall into the inner space of the cube. If at least one vertex lies inside the cube, then the inter-section takes place. Such a check is not difficult, since voxels are represented by orthogonal cubes (their faces are parallel to the coordinate axes).
If none of the vertices falls inside the cube, then it is checked whether the plane of the triangle intersects the given cube. For this, the coordinates of the vertices of the cube P1..P8 are substituted into equation (7). If the result of the calculation for all the vertices has the same sign, then all the vertices of the cube lie on one side of the plane of the triangle T1T2T3 and, therefore, the plane does not intersect the cube. If at least one of the vertices lies on the other side of the plane or on the plane of the triangle, then the inter-section of the plane of the triangle and the cube takes place. In this case, the projections of the cube vertices on the plane of the triangle are built.
In the example in Figure 4, it is enough to find the projection of the trimmed vertex P6 onto the plane of the triangle T1T2T3. For this, it is necessary to obtain the normal equation of the plane T1T2T3. To get the normal equation of the plane from the equation of the plane, you need to calculate the normalization factor:
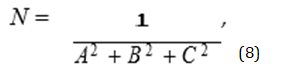
where N is the normalization coefficient, A, B, C are the coefficients of the equation of the plane of the triangle.
The normal equation of the plane is as follows:

where N is the normalization coefficient, A, B, C, D are the coefficients of the equation of the plane of the triangle, x, y, z are the coordinates of an arbitrary point.
In addition, the distance from the point P6 to the plane of the triangle T1T2T3 is found. For this, the coordinates of the point P6 are substituted into equation (9).
Next, the coordinates of the projection of the point P6 onto the plane of the triangle T1T2T3 are found:

where P6 is the top of the cube, Pt is the projection of the point P6 onto the plane of the triangle, N is the normalization coefficient, A, B, C are the coefficients of the equation of the plane of the triangle, ρ is the distance from the point to the plane.
The last step is to check whether Pt belongs to the triangle T1T2T3. The point Pt is inside the triangle if the sum of the angles between the vectors constructed from the point Pt to the vertices of the triangle is 180 degrees (Figure 5). Otherwise, it can be concluded that the point Pt is outside the triangle T1T2T3.
Figure 5. Checking whether a point Pt belongs to a triangle 
Download figure
The values of the angles can be calculated using the vector dot product formula (similar to formula 5), for the angle T1PtT2 it will look like this:
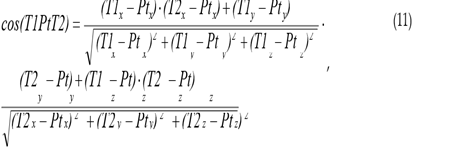
where T1, T2 are the vertices of the triangle, Pt is the point checked for belonging to the triangle. Thus, the criterion for a point Pt to belong to a triangle can be represented in the form of the equation:
 (12)
(12)
where T1, T2, T3 are the vertices of the triangle, Pt is the point checked for belonging to the triangle. A diagram of the algorithm for checking the boundary condition is shown in Figure 6.
Figure 6. Algorithm for checking the boundary condition 
Download figure
Thus, the boundary condition is checked when using Delaunay triangulation as a mathematical description of the heart surface.
Another important operation when checking the boundary condition is finding the distance from an arbitrary point P0 (x0, y0, z0) to the plane S, which is carried out according to the formula:

(13)
where ρ (P0, S) is the distance from the point P0 to the plane S, A, B, C, D are the coefficients of the equation of the plane S, (x0, y0, z0) are the coordinates of the point P0.
A distinctive feature of the proposed presentation surfaces using triangulation is the ability to describe Delaunay triangles using a symmetry transformation. Symmetry is the property of an infinite space or its finite region (figure, body) to be combined with itself after performing some transformations or operations S, called transformations or symmetry operations. Space can be not only Euclid's space, but also any physical space, for example, gravitational fields, electric charges, etc., anisotropic crystalline spaces and their parts.
Thus, symmetry is a generalization of the concept of equality: in geometry, two bodies (figures) are called equal if the distances between the corresponding points are equal r12’=r12. This condition is satisfied by two simply equal bodies, differing in position in space, which can be combined with each other.
Thus, the representation of the surface by means of triangulation provides the specified detail when approximating the shape of the heart and makes it relatively easy to check the boundary conditions when obtaining a volumetric model of the heart.
Results and Discussion
Construction of a Surface Model of the Heart Based on Delaunay Triangulation
The analysis of methods for approximating the surface model of the heart showed that, according to the criterion of computational costs, it is preferable to use Delaunay triangulation for voxelization of the heart model. This representation of the heart and torso models is the basis for the visualization of all heart functioning processes. The use of Delaunay triangulation for the approximation of the heart and torso model is shown in Figure 7 shows a surface model of the heart built on the basis of control points using the Delaunay triangulation algorithm 6. triangulation, and with the heart model located in it.
Figure 7. Triangulated heart and torso images 
Download figure
Visualizing Texture on the Surface of the Heart
The problem of generating textures in real time and manipulating large arrays of visual information when observing images of 3D objects is very relevant when performing a number of tasks. For example, rendering at a frequency of 10 Hz of a scene containing 200 thousand triangles of 100 pixels each, with a texture on each object, will require performance from approximately 500 MFLOPS to 1 GFLOPS 9. When generating textures, the large memory bandwidth requirements, which are caused by the need to display the texture, are associated with the desire to obtain an image of acceptable quality. In this case, it is necessary to perform the filtering operation on the set of texels that fall into the projection of the pixel onto the texture. To reduce computational costs, a number of methods are used, the most famous of which is mip mapping 9. This method requires access to eight texture elements per pixel. Assuming 50% hitting the Z-buffer and using RGB textures, the memory for storing textures should provide a transfer rate of 1.2 GB / s in case you need to apply a texture to each object 9. It is obvious that the formation and processing of such an amount of visual information, and in real time, is only possible for the most modern computer.
The texture is a convenient tool for displaying the state of the heart, because allows you to clearly show on the surface of the heart the place of possible damage. The generation of textures in real time refers, along with the visualization of volumes in real time, to the fundamental problems of computer graphics 10, 11.
The generalized texture mapping algorithm consists of several stages: first, the texture is calculated in memory, then the texture is projected onto the surface of the heart, which is then projected onto a 2-dimensional screen. The most common texture mapping method is from pixel space to texture space 12 (Figure 8). In the case of specifying the surface of the heart with triangles, three texture space coordinates are assigned to the three vertices of the triangle. At the same time, for the correct placement of the texture on the heart, in addition to the texture image itself, it is necessary to establish a correspondence between the coordinates of the vertices of the triangles and the texture:
Figure 8. Illustration of the texture mapping process 
Download figure
The Materials and Methods should be described with sufficient details to allow others to replicate and build on the published results. Please note that the publication of your manuscript implicates that you must make all materials, data, computer code, and protocols associated with the publication available to readers. Please disclose at the submission stage any restrictions on the availability of materials or information. New methods and protocols should be described in detail while well-established methods be briefly described and appropriately cited.
Research manuscripts reporting large datasets that are deposited in a publicly available database should specify where the data have been deposited and provide the relevant accession numbers. If the accession numbers have not yet been obtained at the time of submission, please state that they will be provided during review. They must be provided prior to publication. Interventionary studies involving animals or humans, and other studies that require ethical approval, must list the authority that provided approval and the corresponding ethical approval code.
where p is the vertex of the triangle, x, y, z are the co-ordinates of the vertex p in the three-dimensional co-ordinate system of the object X, Y, Z, W, pt is the point of the texture, s, t are the co-ordinates of the point pt in the coordinate system of the texture.
Two-dimensional coordinates (s, t) are used to define points in texture space. These coordinates vary in the range from 0 to 1. When mapping a texture, four co-ordinate systems (CS) are considered:
The observer's CS x, y, z, w with the origin at the observation point.
On-screen CS xo, yo, which the observer sees. The subscript "o" denotes on-screen CS. These coordinates are obtained from the observer's CS by dividing x and y by w: (15)
CS of the object X, Y, Z, W: {xs, ys, zs, ws} with the origin in the center of the heart.
Texture CS - coordinates t, s, on the plane of the projected texture. Texture coordinates in object coordinates are obtained as
t=x_s/w_s; s=y_s/w_s.(16)
For 3-D texture it is calculated as well. z=z_s/w_s.
When applying a texture, a one-to-one correspondence of the texture SC to the screen SC is provided. Based on the generalized texture mapping algorithm, a detailed texture mapping algorithm has been developed, which is shown in Figure 9.
Figure 9. Texture mapping algorithm 
Download figure
The detailed algorithm includes the following steps:
determination of the position of the observer;
calculation of the field of view;
determination of the required resolution for visualization:
obtaining a map of the location of thematic objects;
getting the parameters of a thematic object;
formation of a mask of a thematic object;
preparation of the thematic texture of the thematic object;
texturing of a thematic object using a mask;
placing a textured thematic object on the target texture;
obtaining a map of the location of 3D objects;
getting the parameters of a 3D object;
definition of the type of objects;
formation of a 3D object model;
getting the texture of a 3D object;
texturing of a 3D object;
rendering of a 3D object;
formation of a mask for the image of a 3D object;
formation of a point or mnemonic image of a 3D object;
forming a mask of a point or mnemonic image of a 3D object
placing an image of a 3D object on the target texture;
visualization.
The essence of the algorithm is that in real time they preliminarily compose a thematic map (a map of the location of thematic objects on the texture), form and store thematic data (various texture samples) and compose a texture map from thematic objects. A texture map is a set of thematic objects that can be modified in real time, such as resizing, positioning, and masking. Topic data refers to a texture sample. Texture generation in real time is based on a new principle of approximation of the border of the docking" of thematic data when compiling a texture map: the formation of thematic objects from thematic data and the generation of a texture map from thematic objects is carried out by means of a mask overlay operation. In other words, the boundaries of "joining" of thematic data when compiling a texture map are "laid" in the form of a thematic object. At the same time, there is no need to use the rules of "docking" to approximate the border of "docking" of thematic data and change the parameters of all thematic elements when changing the size or position of a thematic map section and provides the possibility of overlapping several thematic objects.The algorithm in Figure 9 allows you to generate a realistic texture in real time, regardless of its complexity, the number of objects and possible changes in the parameters of objects (shape, size, position).
Two-dimensional images are used as texture. When building a three-dimensional model of the heart, a texture of 512x256 pixels is used. The texture image is shown in Figure 10.
Figure 10. Sample heart texture image 
Download figure
To visualize myocardial damage on the synthesized image of the heart model, additional texture maps are created, reflecting the corresponding diseases. Each such map contains an image of three zones of damage, marked with the corresponding color: for example, the zone of necrosis is indicated in black, the zone of damage is dark green, and the zone of ischemia is lilac. An illustration of the stages of generating a texture map is shown in Figure 11.
Figure 11. Illustration of the stages of generating a texture 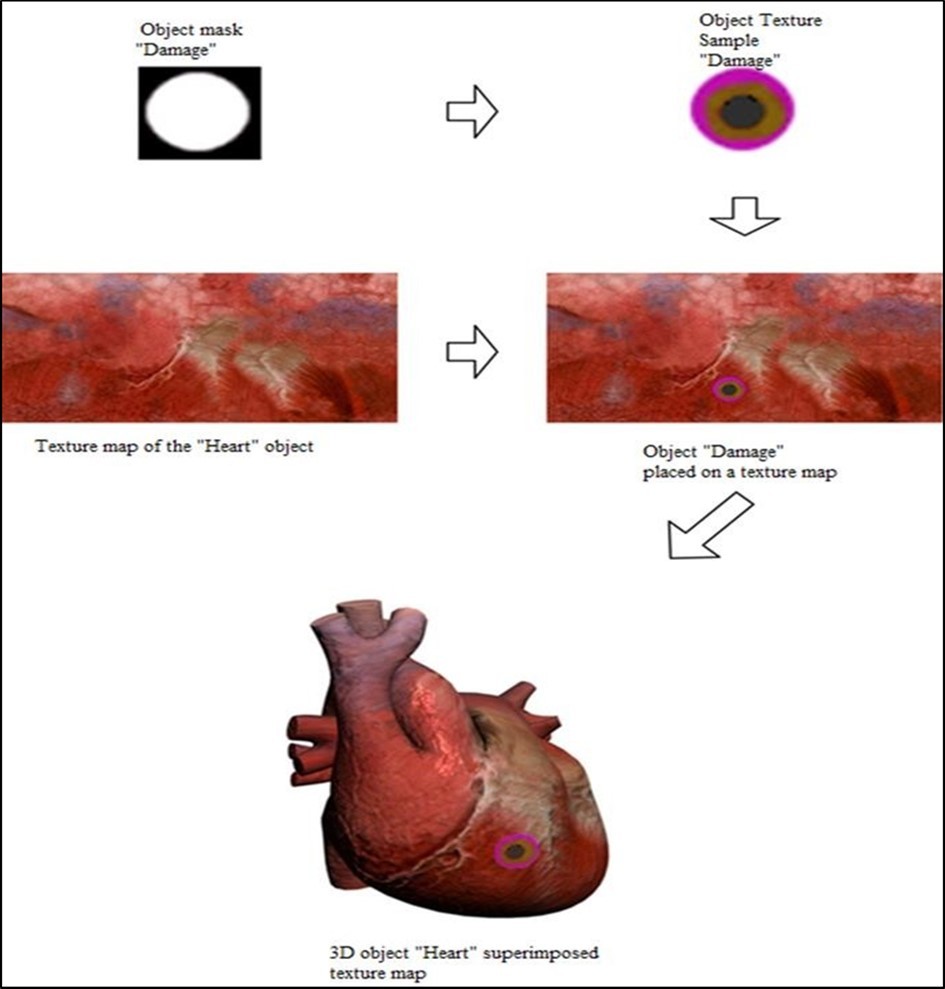
Download figure
The analysis of the above allows us to formulate the requirements for visualization of the state of the heart: Formation of a realistic three-dimensional image of the outer and inner surfaces of the heart. Visualization of the localization of the site of myocardial injury.
Display of the electrical process of the heart, i.e., display on the surface of the heart of the processes of excitation and propagation of electrical activity.
Providing the possibility of interactive work with the synthesized image.
Conclusion
Methods and means of visualization of the state of the heart represent a kind of "window" through which an idea of the individual anatomy of the patient's heart and the peculiarities of its work is created. Methods and means of visualization of the state of the heart are based on the methods of computer graphics.
Thus, the developed realistic surface 3D model and the method for generating textures make it possible to visualize the site of myocardial damage and to display the processes of excitation and propagation of the electrical activity of the heart.