Abstract
Defining protein-protein interactions is essential for understanding the mechanisms by which cells regulate basic functions, such as metabolism, transcription, and signal transduction. Affinity purification followed by tandem mass spectrometry (AP-MS) has application for discovery of new interactors regulating various cellular processes. Here we optimize the purification method for AP-MS and develop a simplified unbiased analytical tool, Z-score plus prey occurrence and reproducibility (ZSPORE) for data analysis. Using this pipeline we achieve a higher efficiency of AP-MS and enhanced identification of high confidence interacting proteins (HCIP) in mammalian cells. When applied to analysis of the innate immune interactome, these methods enhanced HCIP identification. In addition, we investigated the GRB2 complex, which is associated with signal transduction and cell growth. Twenty-four known GRB2 interacting proteins were identified plus 26 new GRB2 binding partners. Thus, these straightforward methods recapitulate known protein interactions, discover novel complexes, and allow mapping of protein interaction networks.
Author Contributions
Academic Editor: Bobbie-Jo M. Webb-Robertson, Senior Research Scientist Pacific Northwest National Laboratory Computational Biology and Bioinformatics Richland, WA, USA
Checked for plagiarism: Yes
Review by: Single-blind
Copyright © 2012 Shitao Li, et al.
 This is an open-access article distributed under the terms of the Creative Commons Attribution License, which permits unrestricted use, distribution, and reproduction in any medium, provided the original author and source are credited.
Competing interests
The authors have declared that no competing interests exist.
Citation:
Introduction
Analysis of protein-protein interaction has contributed numerous insights for understanding the regulation of antiviral defense, DNA repair, autophagy, and immune signaling pathways. Discerning how proteins interact in complex and dynamic networks is a key for dissecting the complexity of many genotype-to-phenotype relationships. Proteomics has emerged as a powerful tool to analyze multicomponent complexes formed under close to physiological conditions. Among various proteomic based methods, affinity purification followed by tandem mass spectrometry (AP-MS) has proven to be highly successful for identification of interacting proteins. Using this approach, global wide interactomes have been established in Escherichia coli 1, Mycoplasma pneumonia 2, Saccharomyces cerevisiae 3, 4, 5, Drosophila melanogaster 6, and HIV-host 7. In vertebrates AP-MS has been used to define proteomic subspaces and specific signal pathways for the antiviral innate immunity pathway 8, autophagy 9, deubiquitinase interactome 10, endoplasmic reticulum-associated protein degradation network 11, tumor necrosis factor signaling 12, proteasome interaction network 13, and disease related protein networks 14.
Various affinity tags have been employed for protein purification, but the FLAG and HA epitopes remain the most popular tags for AP-MS in mammalian cells. To optimize the AP-MS method, we compare purification strategies using the FLAG and HA tags. We also compare the efficacy of single versus tandem FLAG-HA purification on identification of high confidence interacting proteins (HCIP).
Unfiltered AP-MS data include many contaminating or non-specific binding proteins (NSBP). Computational tools are required for the processing of AP-MS data and elimination of NSBP. Programs such as CompPASS 10, SAINT 15, and Mist 7 have been used for analysis of AP-MS data. However, these sophisticated tools are designed for a single dataset with high interconnectivity. Furthermore, existing computational strategies often require complex statistical analysis and introduce empirical rules for elimination of contaminating proteins. We now describe a simplified, unbiased efficient statistical method, Z-score plus prey occurrence and reproducibility (ZSPORE) for identification of HCIP. Using this pipeline we achieve a higher efficiency of AP-MS and robust identification of HCIP. This optimization of affinity purification efficiency plus the newly designed ZSPORE scoring system facilitates enhanced identification of protein complexes.
Results and Discussion
Optimization of AP-MS in Mammalian Cells
The availability of high affinity monoclonal antibodies against the HA and FLAG epitope tags has led to their frequent utilization for affinity purification of protein complexes. These are the most commonly used epitopes for mapping the proteome. To compare the efficacy of these epitopes for affinity purification, FLAG and HA fusion proteins were purified in parallel. The bait proteins used for optimizing affinity purification included MDA5 and other well-known components of the innate immunity network 8, 16, 17. HEK293 cells stably expressing FLAG and HA double tagged MDA5 N-terminal card domain (MDA5-N) were used to compare efficiencies. A total of 4x10⁷ cells were collected and the cell lysate was incubated with either 20 µl anti-FLAG or anti-HA conjugated beads for 12 hr. After washing, the MDA5-N complex was eluted with FLAG or HA peptides. Both strategies yielded purified MDA5-N protein complexes as shown by silver staining (Figure 1A). Quantitative analysis of band intensity demonstrated that purification from anti-FLAG conjugated beads yielded 6.8 fold more protein than anti-HA beads (Figure 1A). Furthermore, purification with anti-FLAG beads pulled down several additional bands (Figure 1A). One band was identified as MAVS, a known MDA5 interactor. In contrast, purification with anti-HA beads did not pull down detectable quantities of MAVS. Taken together, purification with anti-FLAG conjugated beads yield about 7 fold more protein than anti-HA beads, suggesting the FLAG tag is more efficient for AP-MS.
Figure 1.Optimization of AP-MS. (A) Comparison of affinity tag purifications with anti-FLAG and anti-HA antibodies. HEK293 cells stably expressing FLAG and HA tagged MDA5 N-terminal card domain (MDA5-N) are compared. Left panel shows silver staining of MDA5-N complexes purified with HA and FLAG tag. Right panel indicates lane intensity quantitated by densitometry. NSBP stands for non specific binding protein. (B) Comparison of one-step and tandem purifications. Protein numbers identified in TBK1, NAP1, IRF3, and SINTBAD complexes are depicted. F stands for FLAG affinity purification and FH indicates FLAG and HA tandem purification.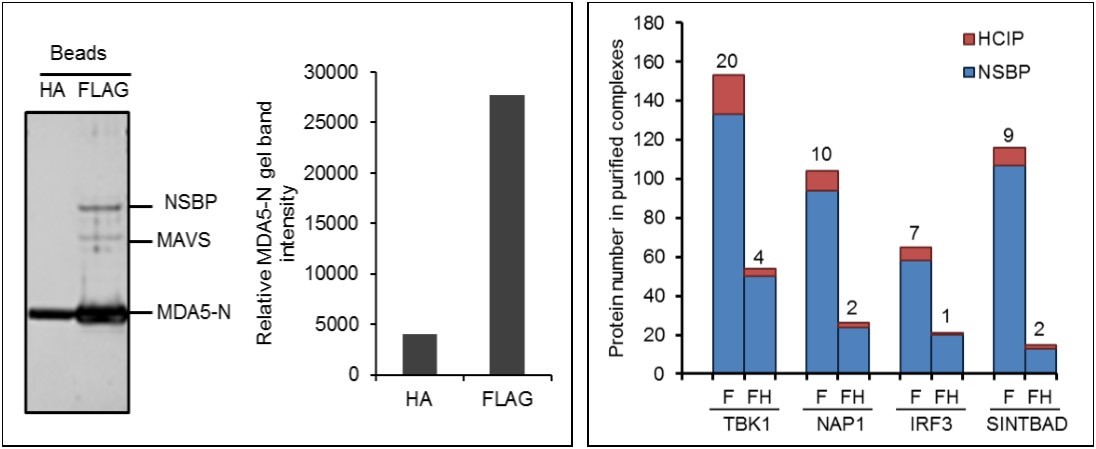
Single tag AP-MS and tandem affinity purification (TAP) are both broadly applied methods for protein purification. TAP is a two-step procedure requiring sequential purification using two different affinity tags. FLAG and HA double tags are most commonly applied for tandem purification of protein complexes. To compare the effect of tandem tag vs. single tag purification on the yield of total prey and HCIP, we compared protein complexes purified by single purification with FLAG vs. a two-step purification with FLAG followed by HA. To compensate for the lower binding capacity of anti-HA beads we used 4 times more anti-HA beads than anti-FLAG beads for immunoprecipitation. The number of HCIP associated with the kinase, TBK1, was determined by the algorithm ZSPORE detailed below. MS analysis revealed that TAP purified TBK1 complexes lacked several known interactors, including optineurin (data not shown). As with other screening methods, AP-MS is unable to detect all interactors. For example, neither single-step nor tandem purification of TBK1 pulled down A20, a TBK1 known interactor 18. We next examined the efficacy of tandem purification using three additional proteins associated with the innate immune signaling pathway (NAP1, IRF3, and SINTBAD). The number of total interactors was dramatically reduced in all protein complexes isolated by TAP purification. However, the ratio of HCIP to total prey did not increase. Consistently, more HCIP were detected by single step affinity purification (Figure 1B). In brief, tandem purification reduces the NSBP at the price of HCIP loss.
Design of ZSPORE Scoring System
As with many screening methods, unfiltered AP-MS data contain many non-specific binding proteins caused by binding to the antibody coated beads, epitope tag, aggregation, or carryover from prior MS runs. Several computational tools have been developed for processing AP-MS data to eliminate NSBP and identify HCIP 7, 10, 15.
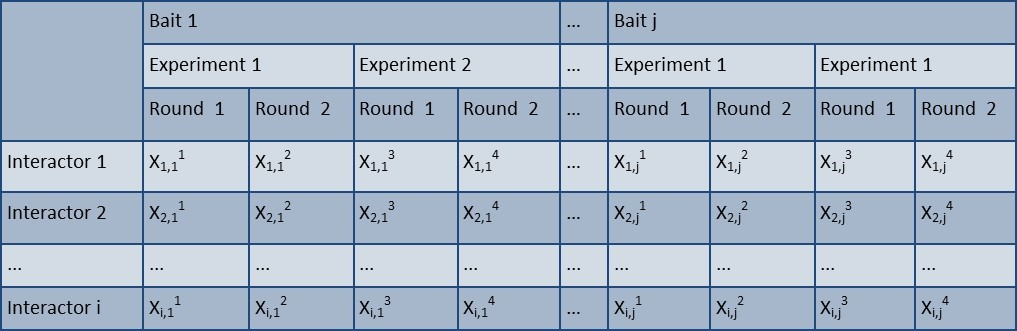
We aimed to create a simplified method for analysis of AP-MS data. Three main parameters (protein abundance, the frequency of observed protein in the database, and reproducibility) were combined to generate an algorithm. Total spectral counts (TSC) have gained acceptance as a practical, label-free, semi-quantitative measure of protein abundance for proteomic studies 19, 20. We adopted the Z-score statistic to compare protein abundance because conventional Z-score determines the number of standard deviations away from the mean. However, Z-score does not reflect reproducibility. In our protocol bait protein complexes are retrieved in two independent experiments, and then each eluate is divided into two aliquots which are analyzed by MS on different days. As each protein complex is tested in at least 4 MS runs, reproducibility can be readily factored into the analysis. Z-score also does not analyze information about prey occurrence (i.e. prey uniqueness). To explore the likelihood that an interaction is specific, we empirically set a value of prey occurrence at < 7%. We now propose a simple 3 stage scoring system to identify HCIP. This algorithm combines Z-score plus prey occurrence and reproducibility (ZSPORE). In the ZSPORE scoring system each interaction must pass all 3 criteria to merit classification as HCIP (Figure 2A). This scoring method is flexible as each parameter can be adjusted to vary the stringency of analysis. The flowchart of ZSPORE is shown as in Figure 2A and a detailed description is provided in Materials and Methods.
Figure 2.ZSPORE analysis and validation. (A) Flowchart of ZSPORE analysis and algorithm. (B) Comparison of HCIP identification by ANOVA and ZSPORE using the innate immune database. (C) Validation of HCIP by co-IP and comparison with BioGRID and STRING databases.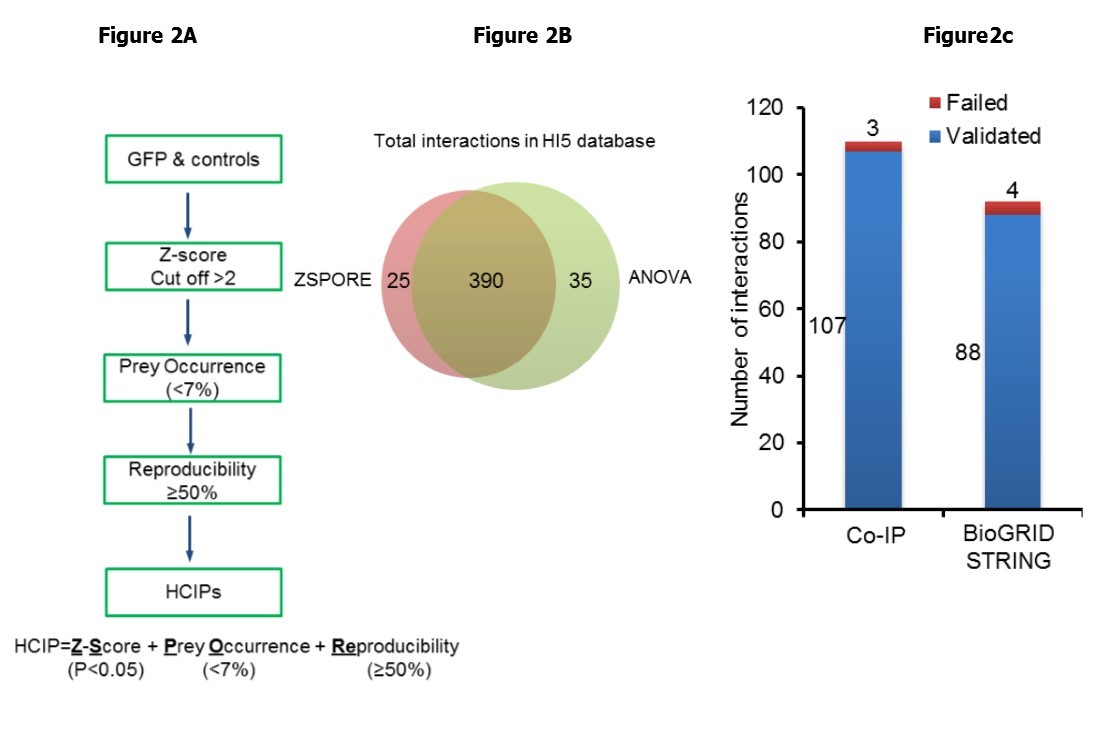
We first evaluated the performance of ZSPORE using our published database of Human Innate Immunity Interactome for type I Interferon (HI5) 8. The HI5 dataset consists of 58 innate immunity genes and 5 negative controls. A total of 9432 pairwise interactions were detected between 1218 preys and 58 baits. We calculated Z-scores for each Xi,j (where X is the maximum TSC associated with prey i which interacts with bait j) based on 4 MS runs. For this analysis we set the Z-score cutoff at 2. The threshold of reproducibility was established at 2 of 4 runs. To minimize NSBP in this small set of baits, prey occurrence was set at <7%. Empirically adjusting the percent of prey occurrence is used to effectively discriminate known interactors in this signaling pathway which features a high rate of interconnectivity among baits. Established bait-to-bait interactions are listed (Table S1). In total 279 HCIP forming 415 total interactions were identified using ZSPORE compared with 425 interactions detected by ANOVA (Table S1). The high overlap of 390 interactions between the ANOVA and ZSPORE analyses validates the efficiency of ZSPORE (Figure 2B). We examined the overlap between ZSPORE and experimental findings by comparing the interactions in public databases and interactions verified by co-immunoprecipitation (co-IP). As shown in Figure 2C, ZSPORE verified 88 out of 92 known interactions reported in the BioGRID and/or STRING databases. ZSPORE also confirmed 107 out of 110 interactions detected by co-IP and reported in our previous study 8. In total, > 96% (195 of 202) verified and known interactions detected with the ZSPORE strategy were validated. This is an improvement over the previous ANOVA-based computational approach 6. The stringent statistical criteria for selecting HCIP may have masked relevant false negatives. Of 345 known interactions 20 (6% false negative) were filtered out as NSBP in the innate immune database according to ZSPORE. Conversely, 3 out of 110 interactions found by ZSPORE could not be validated by co-IP. Therefore, the false positive rate of ZSPORE on the innate immune database is < 3%. Taken together, the ZSPORE method combines three metrics (Z score based on TSC, prey occurrence, and reproducibility). These parameters are embedded in most AP-MS datasets. Thus, ZSPORE is a simple, efficient and robust way to analyze AP-MS data. Recalculation of the innate immune interactome with the ZSPORE algorithm (Table S2) provided an expanded innate immune interactome with 415 interactions.
Our AP-MS database and the simplified computational strategy represent a valuable resource for investigators using the outlined purification procedures, especially those analyzing a small number of baits. Combining datasets will enhance the resolution of HCIP. Dissemination of the database to interested members of the research community can be arranged by contacting the authors. The ZSPORE algorithm may also be applied to large datasets involving other species and cell types.
GRB2 Complex Purification and Identification
To evaluate the ability of the ZSPORE strategy to identify novel HCIP, we applied these tools to a well-characterized adaptor protein. Growth factor receptor-bound protein 2 (GRB2) is ubiquitously expressed and plays a critical role in receptor tyrosine kinase signaling pathways 21, 22, 23. Thus, GRB2 was chosen to validate our AP-MS pipeline (Figure 3). In brief, FLAG-tagged GRB2 was cloned into a CMV-driven vector with hygromycin resistance and transfected into HEK293 cells. After selection with hygromycin the stable cell line was cultured in five 150 cm2 dishes. After affinity purification of the GRB2 complex sample was split into halves and each was run onto a NuPage gel. Short electrophoresis migration (~1 cm) was adopted and the whole lane was excised for mass spectrometry. In our hands MS analysis of individual bands separated by full length electrophoresis failed to show significant improvement of HCIP identification when compared with short electrophoresis. Furthermore, collection of the entire sample in one fraction avoids the complication of analyzing MS data merged from different MS runs of individual bands.
Figure 3.Overview of Optimized Pipeline of AP-MS.
Data from 4 MS runs (replicates from 2 independent purifications) were collected and in total 166 interactors were detected (Table S3). Z-scores were calculated based on the maximum TSC of each prey among 4 independent MS runs and analyzed against our current database of 211 protein complexes (Table S2 and unpublished data). Increasing the size of the core database allows one to apply greater flexibility or stringency in selecting HCIP. 73 preys showed Z-scores higher than 2 (p< 0.05). Next we investigated prey occurrence; one prey was filtered out based on its occurrence in >7% in our database. Reproducibility of GRB2 data revealed 54 preys (79%) appeared at least twice out of 4 MS runs. Finally, 4 proteins with only one peptide hit were removed. Taken together, we identified 50 HCIPs associated with GRB2 (Table 1).
Table 1. HCIPs of GRB2 complex| Gene Name | Z-score | Prey Occurrence | Reproducibility |
| GRB2 growth factor receptor-bound protein 2 | 14 | 0.60% | 100% |
| ASAP1 ArfGAP with SH3 domain, ankyrin repeat and PH domain 1 | 14 | 3.70% | 100% |
| BAT2 HLA-B associated transcript 2 | 10 | 1.20% | 100% |
| C2orf44 chromosome 2 open reading frame 44 | 14 | 0.60% | 100% |
| CBL Cas-Br-M (murine) ecotropic retroviral transforming seq | 14 | 0.60% | 100% |
| CBLB Cas-Br-M (murine) ecotropic retroviral transforming seq | 6 | 1.20% | 100% |
| CPSF7 cleavage and polyadenylation specific factor 7, 59kDa | 14 | 0.60% | 100% |
| DIAPH1 diaphanous homolog 1 (Drosophila) | 14 | 0.60% | 100% |
| DNM1 dynamin 1 | 14 | 1.00% | 100% |
| DNM2 dynamin 2 | 14 | 0.60% | 100% |
| DNM3 dynamin 3 | 14 | 0.40% | 75% |
| DOCK1 dedicator of cytokinesis 1 | 14 | 0.30% | 50% |
| ELMO2 engulfment and cell motility 2 | 14 | 0.60% | 100% |
| FAM59A family with sequence similarity 59, member A | 14 | 0.60% | 100% |
| GAB1 GRB2-associated binding protein 1 | 14 | 0.60% | 100% |
| GAB2 GRB2-associated binding protein 2 | 11 | 3.40% | 100% |
| KHDRBS1 KH domain containing, RNA binding, signal transduction associated 1 | 14 | 0.40% | 75% |
| KHDRBS3 KH domain containing, RNA binding, signal transduction associated 3 | 14 | 0.30% | 50% |
| KIF4A Kinesin family member 4A | 14 | 0.60% | 100% |
| KIF4B kinesin family member 4B | 14 | 0.70% | 100% |
| KIFC1 kinesin family member C1 | 14 | 0.60% | 100% |
| MAP4K5 mitogen-activated protein kinase kinase kinase kinase 5 | 7 | 0.60% | 50% |
| NISCH nischarin | 14 | 0.70% | 100% |
| NKX2-5 NK2 transcription factor related, locus 5 (Drosophila) | 14 | 0.30% | 50% |
| OCRL oculocerebrorenal syndrome of Lowe | 14 | 0.60% | 100% |
| PIK3AP1 phosphoinositide-3-kinase adaptor protein 1 | 14 | 0.40% | 75% |
| PIK3C2B phosphoinositide-3-kinase, class 2, beta polypeptide | 5 | 0.40% | 75% |
| PIK3CA phosphoinositide-3-kinase, catalytic, alpha polypeptide | 13 | 0.70% | 100% |
| PIK3CB phosphoinositide-3-kinase, catalytic, beta polypeptide | 14 | 1.20% | 100% |
| PIK3R1 phosphoinositide-3-kinase, regulatory subunit 1 (alpha) | 8 | 4.50% | 100% |
| PIK3R2 phosphoinositide-3-kinase, regulatory subunit 2 (beta) | 8 | 1.30% | 75% |
| POLD1 polymerase (DNA directed), delta 1, catalytic subunit 1 | 14 | 0.60% | 100% |
| PTPN11 protein tyrosine phosphatase, non-receptor type 11 | 14 | 0.70% | 100% |
| PTPN23 protein tyrosine phosphatase, non-receptor type 23 | 14 | 0.60% | 100% |
| PTPRA protein tyrosine phosphatase, receptor type, A | 14 | 0.70% | 100% |
| RBM15 RNA binding motif protein 15 | 14 | 0.60% | 100% |
| SATB1 SATB homeobox 1 | 14 | 0.60% | 100% |
| SGK269 NKF3 kinase family member | 14 | 0.60% | 100% |
| SH3PXD2B SH3 and PX domains 2B | 14 | 0.30% | 50% |
| SHC1 Src homology 2 domain containing) transforming protein 1 | 14 | 0.40% | 75% |
| SNX18 sorting nexin 18 | 14 | 0.60% | 100% |
| SOS1 son of sevenless homolog 1 (Drosophila) | 14 | 0.60% | 100% |
| SOS2 son of sevenless homolog 2 (Drosophila) | 14 | 0.40% | 75% |
| STAMBP STAM binding protein | 14 | 0.60% | 100% |
| WASL Wiskott-Aldrich syndrome-like | 10 | 4.50% | 100% |
| WDR6 WD repeat domain 6 | 14 | 0.60% | 100% |
| WIPF1 WAS/WASL interacting protein family, member 1 | 14 | 0.60% | 100% |
| WIPF2 WAS/WASL interacting protein family, member 2 | 14 | 0.60% | 100% |
| WIPF3 WAS/WASL interacting protein family, member 3 | 14 | 0.60% | 100% |
| ZMYM2 zinc finger, MYM-type 2 |
Cytoscape software was used to visualize the interconnectivity of the GRB2 complex and combine the interactions into one map (Figure 4). The Z-score and TSC values are represented by line color and thickness, respectively (Figure 4). Comparisons with the BioGRID and STRING public protein interaction databases identified 24 known GRB2 binding proteins (23 in BioGRID, 13 in STRING, and 12 in both), including some well-known partners, SOS1/2, GAB1/2, PI3K and CBL (Figure 5A). The data were consolidated into a GRB2 interaction map, prey colors represent known interactions found in the BioGRID and/or STRING databases (Figure 4). Overview of the GRB2 network reveals clusters of related proteins (including members of the PI3K, WIPF, DNM and KIF4 families), which belong to structurally and functionally related gene families. GRB2 associates with 18 known GRB2 interactors highlighted by dashed lines forming a sub-network with high interconnectivity.
Figure 4.GRB2 complex purification and analysis. Protein interaction network of GRB2 complex using Cytoscape. Z-score and TSC are represented by line color and thickness, respectively. The fill color indicates novel or known GRB2 interactors as designated. Dashed lines represent known interactions between GRB2 interactors.
Figure 5.Analysis of GRB2 interactome. (A) Comparison of GRB2 complex with BioGRID and STRING public protein interaction databases. (B) Functional categorization of GRB2 interactors. (C) Pfam domain distribution among GRB2 interactors.
Successful identification of known interactions established the efficiency and robustness of our AP-MS pipeline. We also identified 26 new interactors associated with GRB2. For example, protein diaphanous homolog 1 (DIAPH1) is a new GRB2 partner with 11 peptide hits. DIAPH1 is involved in MEMO1-RHOA-DIAPH1 signaling pathway, which plays an important role in ERBB2-dependent stabilization of microtubules at the cell cortex 24. Since GRB2 is an adaptor of EGFR receptors, GRB2 may bridge DIAPH1 to ERBB2. Functional categorization of GRB2 interactors suggests that GRB2 not only plays a role in growth receptor pathways like ERBB and VEGF, but also crosstalks with the JAK-STAT, mTOR, and immune cell receptor signaling pathways (Figure 5B). Another interesting novel GRB2 binding partner is ARAP1 (Arf-GAP with Rho-GAP domain, ANK repeat and PH domain-containing protein 1). ARAP1 is strongly associated with GRB2 (61 peptide counts). ARAP1 is a PIP3-dependent Arf GAP that regulates Arf-, Rho-, and Cdc42-dependent cell activities 25. Furthermore, analysis of the domains contained among GRB2 interactors found several novel GRB2 interactors share domains with previously established interactors (Figure 5C). For example, SNX18 and SH3PXD2B have the PX and SH3 domains characteristic of PI3K family members.
In summary, the methods described here represent a broadly applicable pipeline from affinity purification of protein complexes to statistical analysis of AP-MS data. We validated the utility of this strategy by defining an enlarged innate immune network. To further demonstrate the advantage of these tools on a well-studied protein we analyzed the GRB2 complex. In addition to 24 known interacting proteins, we also identified 26 new binding partners. The robustness of our AP-MS pipeline supports its widespread application in the characterization of protein interaction networks for various signaling pathways in different cell types.
Many processes in a cell depend on protein-protein interactions and perturbations of these interactions can lead to pathophysiology. Comprehensive knowledge of protein interaction networks will identify novel components and yield new insights on how cells respond to different environments. Ultimately such knowledge may provide new targets for therapeutic application. In conclusion, this approach to AP-MS is an invaluable tool for identification of new protein-protein interactions and mapping protein interaction networks.
Materials and Methods
Cells and Reagents.
HEK293 cells were purchased from ATCC. Human GRB2 cDNA was ordered from PlasmID (Dana-Farber, Boston). Antibodies specific for FLAG and HA were purchased from Sigma Chemical Co (St. Louis, MO).
AP-MS Procedures
Bait Cloning
MDA5-N (1-294), TBK1, NAP1, IRF3 and SINTBAD were tagged with HA-FLAG double tag as detailed elsewhere 8. GBR2 cDNA was tagged with FLAG epitope. All these cDNA were cloned into mammalian expression vector, pCMVTag with hygromycin resistance (Invitrogen).
Stable Cell Line Selection. The constructs were transfected into HEK293 cells. Transfection of plasmids was performed using Lipofectamine 2000 (Invitrogen)26, 27. Two days after transfection, cells were treated with hygromycin for 14 days. Single colonies were picked and expanded in 6-well plates.
Complex Purification
Cells from four 15 cm2 plates (~4X10⁷ cells) were collected in 10 ml TAP buffer (50 mM Tris-HCl (pH 7.5), 10 mM MgCl2, 100 mM NaCl, 0.5% Nonidet P40, 10% glycerol, phosphatase inhibitors and protease inhibitors). After shaking on ice for 30 min, cell lysates were centrifuged for 30 min at 15,000 rpm. Supernatants were collected and precleared with 50 µl of protein A/G resin. After shaking for 1 hr at 4°C, resin was removed by centrifugation. Cell lysates were added to 40 µl anti-FLAG M2 resin (Sigma) and incubated on a shaker. After 12 hr, anti-FLAG M2 resin was 3X washed (15 min) with 10 ml TAP buffer. After removing the wash buffer the resin was transferred to a spin column (Sigma) and incubated with 80 µl 3 mg/ml 3X FLAG peptide (Sigma) for 1 hr at 4°C in a shaker. Eluates were collected by centrifugation and stored at -80°C. Methods of tandem affinity purification are detailed elsewhere 28.
Silver Staining
Purified complexes were loaded onto a 4-15% NuPAGE gel (Invitrogen) and run for about 1cm (8 min at 200 volts). Gels were stained using the SilverQuest staining kit (Invitrogen). The entire stained area was excised as one sample and rinsed twice with 50% acetonitrile. As an alternative approach to in-gel digestion, protein mixtures can be digested in solution without prior separation. Because buffer components, such as detergents, interfere with the mass spectrometry ionization process, protein samples need to be precipitated with trichloroacetic acid (TCA), washed and re-dissolved in a digestion buffer. The main advantages of solution digestion are higher recovery of peptides compared to in-gel digestion and time savings. However, some proteins, especially like membrane proteins are resistant to re-dissolve. Therefore, we prefer in-gel digestion.
Mass spectrometry. The Taplin Biological Mass Spectrometry Facility (Harvard Medical School) was used for MS analysis. As described previously 8, excised gel bands were cut into approximately 1 mm3 pieces. Gel pieces were then subjected to a modified in-gel trypsin digestion procedure. Gel pieces were washed and dehydrated with acetonitrile for 10 min. followed by removal of acetonitrile. Pieces were then completely dried in a speed-vac. Gel pieces were rehydrated with 50 mM ammonium bicarbonate solution containing 12.5 ng/µl modified sequencing-grade trypsin (Promega, Madison, WI) at 4ºC. After 45 min, the excess trypsin solution was removed and replaced with 50 mM ammonium bicarbonate solution to just cover the gel pieces. Peptides were later extracted by removing the ammonium bicarbonate solution, followed by one wash with a solution containing 50% acetonitrile and 1% formic acid. The extracts were then dried in a speed-vac (~1 hr) and stored at 4ºC until analysis.
On the day of analysis the samples were reconstituted in 5 - 10 µl of HPLC solvent A (2.5% acetonitrile, 0.1% formic acid). A nano-scale reverse-phase HPLC capillary column was created by packing 5 µm C18 spherical silica beads into a fused silica capillary (100 µm inner diameter x ~12 cm length) with a flame-drawn tip. After equilibrating the column, each sample was loaded via a Famos auto sampler (LC Packings, San Francisco CA) onto the column. A gradient was formed and peptides were eluted with increasing concentrations of solvent B (97.5% acetonitrile, 0.1% formic acid).
As peptides eluted they were subjected to electrospray ionization and then entered into an LTQ Velos ion-trap mass spectrometer (ThermoFisher, San Jose, CA). Peptides were detected, isolated, and fragmented to produce a tandem mass spectrum of specific fragment ions for each peptide. Dynamic exclusion was enabled such that ions were excluded from reanalysis for 30 s. Peptide sequences (and hence protein identity) were determined by matching protein databases with the acquired fragmentation pattern by the software program, Sequest (ThermoFisher, San Jose, CA). The human IPI database (Ver. 3.6) was used for searching. Precursor mass tolerance was set to +/- 2.0 Da and MS/MS tolerance was set to 1.0 Da. A reversed-sequence database was used to set the false discovery rate at 1%. Filtering was performed using the Sequest primary score, Xcorr and delta-Corr. Spectral matches were further manually examined and multiple identified peptides (≥ 2) per protein were required for consideration as HCIP.
(3) Prey Occurrence. We considered any prey associated with a single bait as a HCIP while preys associated with all baits as NSBP. Generally we set the bar of prey occurrence at <7%, which indicates one specific prey interacts with less than 7% of total baits in the entire database.
(4) Reproducibility. We consider at least 50% reproducibility necessary for classification of HCIP. Thus, each prey must appear in at least 2 out of 4 MS runs. To minimize the list of background contaminants observed in our dataset that were not identified by other statistical approaches, we intentionally analyzed two biological replicates .Each duplicate purified complex was analyzed twice in independent experiments.
The simple and straightforward methods of ZSPORE are easily performed using various kinds of standard office software including Excel.
Bioinformatics Analysis
Public protein interaction databases include the STRING database (protein.links.v7.1.txt.gz, found at http://string.embl.de/) and the BioGRID database (http://www.thebiogrid.org/downloads.php). The protein interaction network was generated in Cytoscape (http://www.cytoscape.org).
ZSPORE Evaluation of Mass Spectrometry Data
The methods and criteria used to remove non-specific binding proteins (NSBP) and identify high confidence interacting proteins (HCIP) include Figure 2A. (2)each Xi,j (prey i interacts with bait j) based on the maximum total spectral counts (TSC) of4 MS runs.
Supplemental Materials
Acknowledgements
This work was supported by NIH grants AI089829 and AI099860. S.L. is a John and Virginia Kaneb fellow.
References
- 1.Hu P. (2009) Global functional atlas of Escherichia coli encompassing previously uncharacterized proteins. PLoS Biol. 7(4), 96.
- 2.Kuhner S. (2009) Proteome organization in a genome-reduced bacterium. Science. 326(5957), 1235-40.
- 3.N J Krogan. (2006) Global landscape of protein complexes in the yeast Saccharomyces cerevisiae. Nature. 440(7084), 637-43.
- 4.A C Gavin. (2006) Proteome survey reveals modularity of the yeast cell machinery. Nature. 440(7084), 631-6.
- 5.Ho Y. (2002) Systematic identification of protein complexes in Saccharomyces cerevisiae by mass spectrometry. Nature. 415(6868), 180-3.
- 8.Li S. (2011) Mapping a dynamic innate immunity protein interaction network regulating type I interferon production. Immunity. 35(3), 426-40.
- 10.M E Sowa. (2009) Defining the human deubiquitinating enzyme interaction landscape. Cell. 138(2), 389-403.
- 11.J C Christianson. (2012) Defining human ERAD networks through an integrative mapping strategy. Nat Cell Biol. 14(1), 93-105.
- 12.Bouwmeester T. (2004) A physical and functional map of the human TNF-alpha/NF-kappa B signal transduction pathway. Nat Cell Biol. 6(2), 97-105.
- 13.Guerrero C. (2008) Characterization of the proteasome interaction network using a QTAX-based tag-team strategy and protein interaction network analysis. Proc Natl Acad Sci U S A 105(36), 13333-8.
- 14.R M Ewing. (2007) Large-scale mapping of human protein-protein interactions by mass spectrometry. Mol Syst Biol. 3, 89.
- 15.Breitkreutz A. (2010) A global protein kinase and phosphatase interaction network in yeast. Science. 328(5981), 1043-6.
- 16.Takeuchi O, Akira S. (2010) Pattern recognition receptors and inflammation. Cell. 140(6), 805-20.
- 17.V G Bhoj, Z J Chen. (2009) Ubiquitylation in innate and adaptive immunity. Nature. 458(7237), 430-7.
- 18.Gao L.ABIN1 protein cooperates with TAX1BP1 and A20 proteins to inhibit antiviral signaling. , J Biol Chem 286(42), 36592-602.
- 19.A C Gingras, Raught B. (2012) Beyond hairballs: The use of quantitative mass spectrometry data to understand protein-protein interactions. FEBS Lett. 586(17), 2723-31.
- 20.Burckstummer T. (2006) An efficient tandem affinity purification procedure for interaction proteomics in mammalian cells. Nat Methods. 3(12), 1013-9.
- 21.Lin C C. (2012) . Inhibition of Basal FGF Receptor Signaling by Dimeric Grb2. Cell 149(7), 1514-24.
- 22.E J Lowenstein. (1992) The SH2 and SH3 domain-containing protein GRB2 links receptor tyrosine kinases to ras signaling. Cell. 70(3), 431-42.
- 23.Jang I K, Zhang J, Gu H. (2009) Grb2, a simple adapter with complex roles in lymphocyte development, function, and signaling. , Immunol Rev 232(1), 150-9.
- 24.Zaoui K. (2010) ErbB2 receptor controls microtubule capture by recruiting ACF7 to the plasma membrane of migrating cells. Proc Natl Acad Sci U S A 107(43), 18517-22.
- 26.Li S, Wang L, M E Dorf. (2009) PKC phosphorylation of TRAF2 mediates IKKalpha/beta recruitment and K63-linked polyubiquitination. Mol Cell. 33(1), 30-42.
Cited by (2)
- 1.Li Shitao, 2013, , , 3(), 17, 10.1007/978-94-007-5811-7_2
- 2.Fu Bishi, Li Shitao, Wang Lingyan, Berman Michael A, Dorf Martin E, 2014, The ubiquitin conjugating enzyme UBE2L3 regulates TNFα-induced linear ubiquitination, Cell Research, 24(3), 376, 10.1038/cr.2013.133