
Single Nucleotide Polymorphism Profiles of Patients with Acute Renal Rejection to Personalize Immunosuppressive Therapy: Preliminary Results from An On-Going, Italian Study
Abstract
Single-nucleotide polymorphisms (SNPs) in genes involved in immune responses and in the pharmacokinetics/pharmacodynamics of immunosuppressive drugs influence transplant outcomes of patients receiving the same immunosuppressive therapy.
The aim of our preliminary study was to determine the SNPs profiles of ABCB1/MDR-1, UGT1A9, IMPDH2, IL-10 and TNF-α genes associated with acute rejection (AR) events in renal allograft recipients. DNA was extracted from whole blood samples of 220 individuals in 3 experimental groups; Case: 41 kidney transplant patients with AR event(s), Control I: 109 kidney transplant patients without AR event, Control II: 70 healthy blood donors. Acute rejection defined as rapid, unexplained rise in serum creatinine was biopsy-proven. 19 SNPs were analyzed by Sanger Sequencing. Analysis of allele and genotype frequencies and gene-disease association tests were performed. Allele frequencies of healthy persons are in line with ones reported from Europe indicating that the studied population is representative. Statistically significant differences only by the comparison of kidney transplant patients with AR event(s) and healthy individuals are found for rs2032582 and rs1045642 SNPs of ABCB1/MDR1, the latter is also not in Hardy-Weinberg equilibrium in our population. Patients with specific alleles for these SPNs are more prone to have acute rejection events.
Certain allele variants of ABCB1/MDR1 by modifying the effectiveness of the drugs may compromise the success of the immunosuppressive therapy and put patients at higher risk to reject the new organ. Therefore screening for these polymorphisms before transplantation would help clinicians to more accurately personalize medications.
Author Contributions
Academic Editor: Mediha Boran, Liv Hospital, Istinye University, Turkey
Checked for plagiarism: Yes
Review by: Single-blind
Copyright © 2017 Elisa Scalzotto, et al.
 This is an open-access article distributed under the terms of the Creative Commons Attribution License, which permits unrestricted use, distribution, and reproduction in any medium, provided the original author and source are credited.
Competing interests
The authors have declared that no competing interests exist.
Citation:
Introduction
Despite the recent advances in immunosuppressive therapies, acute rejection episodes (ARE) following organ transplantation may happen even in the presence of the maximal antirejection treatment. Whenever acute rejection is confirmed, the possibility of inadequate immunosuppression, whether due to insufficient dosing or noncompliance, must be addressed. The failure to recognize this contributing factor increases the risk of continued AREs and poor long-term immunosuppression may eventually lead to graft failure.
Acute renal rejection is a sudden decline in the function of the transplanted kidney that gives rise to the creatinine levels. Rapid deterioration in the allograft function is associated with specific pathologic changes in the graft. The acute cellular rejection is characterized by infiltration of the allograft by lymphocytes and other inflammatory cells. In acute antibody-mediated rejection, the diagnosis requires morphologic evidence of acute tissue injury, circulating donor-specific alloantibodies, and immunologic proof of an antibody-mediated process (such as C4d deposition in the allograft)1.
Transplant outcomes exhibit substantial inter-individual variability among patients receiving the same immunosuppressive medications. Genetic variability beyond that of the major histocompatibility complex (MHC) molecules 2, offers a possible explanation for the heterogeneity between individuals on the clinical course post-transplant 3.
Recent studies have shown that certain single-nucleotide polymorphisms (SNPs) in genes involved in immune responses and in the pharmacokinetics/pharmacodynamics of immunosuppressive drugs are associated with allograft rejection of several organs, as well as in kidney transplant recipients 4, 5.
Pharmacokinetics of calcineurin inhibitors (like Tacrolimus, Cyclosporine) are influenced by the multi-drug resistance 1 transmembrane pump (MDR-1) 6. Tacrolimus is transported out of the intestine, liver and kidney cells via p-glycoprotein, an efflux pump encoded by the MDR-1 gene, which is also expressed on numerous leukocytes, including T and B lymphocytes 7.
The immunosuppressive agent mycophenolic acid (MPA) is metabolized by uridine diphosphate glucuronosyltransferase 1A9 (UGT1A9). It is mainly expressed in the liver but it can be found also in the gastrointestinal tract and kidney. Several polymorphisms in this gene have been reported to enhance the glucuronidation of MPA that in turn results in a lower MPA exposure 8, 9.
Inosine monophosphate dehydrogenase (IMPDH), the rate-limiting enzyme for de novo synthesis of guanine nucleotides, is required for cellular (for example: lymphocyte) proliferation. Inhibition of IMPDH2 by MPA constitutes part of an immunosuppressive therapy, in kidney allograft recipients too. Polymorphic variants of this gene has been associated with increased IMPDH2 activity and reduced ability of MPA to exert antiproliferative effects on lymphocytes 10.
Cytokines by affecting immune responses are also involved in allograft rejection 11. It has been revealed that tumor necrosis factor-alpha (TNF-alpha) and interleukin-10 (IL-10) play a key role in the pathogenesis of transplant organ reperfusion injury and failure and are produced in the graft during kidney rejection 12.
Therefore the aim of the study was to determine complex SNPs patterns (allele and genotype frequencies), of genes involved in immune responses and in the pharmacokinetics/pharmacodynamics of immunosuppressive drugs, characteristic for kidney transplant patients with acute rejection events.
Experimental Procedure
This single-center, observational, non-matched, case-control study was approved by the Vicenza Ethics Committee number 32/11. The protocol was the following: enrolment, blood samples collection, DNA isolation, sequencing by capillary electrophoresis.
A written informed consent was obtained from all persons enrolled in the study in accordance with the Helsinki Declaration. All individuals were Caucasians and at least 18 years old.
Kidney transplant patients with acute rejection event(s) were assigned to the Case group. Acute rejection events, defined as a rapid and unexplained rise in serum creatinine, were always biopsy-proven following the BANFF Classification system 1.
Kidney transplant patients without an acute rejection event were delegated to the Control I group. Healthy blood donor individuals, without any known or generally checked diseases, were designated in the Control II group.
For the Case and Control I group age and gender were collected from the patients’ clinical diaries.
The following SNPs were examined: rs1800872 for IL-10, rs1800629 for TNF-alpha; rs1045642, rs1128503, rs2032582 for ABCB1/MDR-1, rs2741045, rs2741046, rs6714486, rs17868320 for UGT1A9; rs1155754, rs11557547, rs11557541, rs11557545, rs11557542, rs11557544, rs11706052, rs11557546, rs11557540, rs1049818 for IMPDH2.
Materials and Methods
Blood Sample Collection and DNA Isolation
Blood samples (9 ml) were collected in EDTA-containing tubes, genomic DNA was isolated using magnetic bead-based extraction method (NorDiag Arrow instrument with Arrow Blood DNA kit) and aliquots were stored at -80°C until further analysis.
PCR Amplification and Fragment Purification
All subjects were genotyped for each SNP by polymerase chain reaction (PCR) using specific primers designed with Primer3 program (Whitehead Institute) and using AmpliTaq Gold 360 Master Mix (Applied Biosystems).
Amplification conditions were optimized and sequencing analysis was performed for all primers. The characteristics of the primers and amplicons for all 19 SNPs are shown in Figure 1, Figure 2, Figure 3, Figure 4, Figure 5.
Figure 1.Characteristics of the primers and amplicon for 1 SNP in IL-10 gene
Figure 2.Characteristics of the primers and amplicon for 1 SNP in TNF-α gene
Figure 3.Characteristics of the primers and amplicons for 3 SNPs in ABCB1/MDR1 gene
Figure 4.Characteristics of the primers and amplicons for 4 SNPs in UGT1A9 gene
Figure 5.Characteristics of the primers and amplicons for 10 SNPs in IMPDH2 gene
Thermal cycling was performed according to the following protocols: initial denaturation: 10 min at 95°C, 35 amplification cycles of: denaturation: 30 sec at 95°C; annealing: rs1045642, rs1128503, rs2032582 (ABCB1/MDR1) 30 sec at 54°C; rs6714486, rs2741045, rs2741046 (UGT1A9) 30 sec at 54°C; rs17868320 (UGT1A9) 30 sec at 58°C; rs1155754, rs11557547, rs11557541, rs11557545, rs11557542, rs11557544, rs11706052, rs11557546 (IMPDH2) 30 sec at 58°C; rs11557540 (IMPDH2) 30 sec at 60°C; rs1049818 (IMPDH2) 30 sec at 66°C; rs1800629 (TNF-α) 30 sec at 56°C; rs1800872 (IL-10)30 sec at 54°C; extension: 40 sec at 72°C, final cycle:10 min at 72°C.
The length of the amplified fragments has been controlled by electrophoresis in 2% agarose gel stained with SYBR safe 100X (Invitrogen).
Purification of the fragments was performed with ExoSAP-IT (Affymetrix) according to the instructions of the manufacturer.
Sequencing Reaction and Capillary Electrophoresis
Sanger sequencing PCR was performed with Big Dye Terminator v3.1 Cycle Sequencing Kit (Applied Biosystems) as suggested by the manufacturer.
For each sample, two sequencing reactions were prepared with both forward and reverse primers. Products of the reactions were purified using the kit Centri-Sep Spin Columns (Applied Biosystems), according to the protocol recommended by the manufacturer, and then were analyzed by capillary electrophoresis using AB 3500 Genetic Analyzer (Applied Biosystems). The obtained sequences were evaluated by Cromas 2.33 program and compared with the wild type sequences annotated in GeneBank by the BLAST software.
Statistical Analysis
Sample size analysis was performed by QUANTO program version 1.2.3 (α=5% and power (1-β)=80%). Age and gender composition of the groups was compared by one-way ANOVA test. Comparison between two experimental groups was done by unpaired, two-tailed t-test. Observed heterozygosity (HET observed) and expected genotype frequencies in Hardy–Weinberg equilibrium (HWE) were calculated for each SNP, in each group. The deviation from HWE (HWE p) and differences in allele and genotype frequencies were tested by a chi-square test. Candidate gene–disease associations including, ‘per-Genotype’, ‘per-Allele’ and linear trend tests were performed by SAS software Version 9.4 (SAS Institute Inc., Cary, NC, USA).
Results
Characteristics of the Population
The clinical characteristics of the groups are summarized in Figure 6.
Figure 6.Characteristics of the population. Age and gender compositions of the experimental groups. Median values are reported. P-values of the chi-square test are indicated.
220 individuals were included in the study. All patients received a standard immunosuppressive therapy: calcineurin inhibitors, mycophenolate mofetil and steroids were given.
The average age of the studied population is 53.1 years. There is a statistically significant difference in the median age (p25th-p75th) between the three groups.
In the study 63 females and 157 males were enrolled. There is a statistically significant difference in the gender composition between the three groups (p < 0.01).
Genotyping
Observed heterozygosity and the deviation from the heterozygosity expected in Hardy-Weinberg equilibrium were calculated for each SNP separately for each group. Values are shown in Figure 7, Figure 8 and Figure 9. All SNPs of IMPDH2 (except rs11706052) have a HET value 0 because only 1 allele was found at that locus.
Figure 7.Heterozygosity (HET) and deviation from Hardy-Weinberg equilibrium (HWE p) in the Control I group. HET was calculated from the observed allele frequencies. Differences between observed and in HWE expected heterozigosity was tested by a chi-square test (HWE p).
Figure 8.Heterozygosity (HET) and deviation from Hardy-Weinberg equilibrium (HWE p) in the Control II group. HET was calculated from the observed allele frequencies. Differences between observed and in HWE expected heterozigosity was tested by a chi-square test (HWE p).
Figure 9.Heterozygosity (HET) and deviation from Hardy-Weinberg equilibrium (HWE p) in the Case group. HET was calculated from the observed allele frequencies. Differences between observed and in HWE expected heterozigosity was tested by a chi-square test (HWE p).
In the Control I and II groups, the corresponding p values are above 0.05 indicating a stable equilibrium for each polymorphism. In the Case group rs1045642 of ABCB1/MDR1 is not in HWE (indicated with bold letter). When a disequilibrium is not due to a technical error, the
statistical evaluation of the data should involve statistical tests using genotype frequencies rather than allele frequencies 5, 7.
Allele Frequencies
The observed allele frequencies in the three groups compared with that of the European population and all races (data from Ensemble database) are summarized in Figure 10. The allele frequencies in the European population and in our healthy, control II group are similar.
Figure 10.Allele frequencies from Europe and from the world and observed in our experimental groups. The ancestral allele is indicated with bold letters.
Genotype Frequencies
There is a similar trend in the observed genotypes frequencies in all three groups, reported in Figure 11. The more frequent genotype in a group is the same in the other groups.
Figure 11.Genotype frequencies in the experimental groups.
No transplant patients with acute rejection are A/T heterozygote for rs2032582 of ABCB1/MDR1; as no healthy individuals are A/T or A/G heterozygote for rs2032582 of ABCB1/MDR1. No individuals in the Control I and II groups are G/G homozygote for rs11706052 of IMPDH2.
Genetic Association
We analyzed all SNPs per-allele, per-genotype and we performed linear trend test between all three groups. The results are summarized in Figure 12, Figure 13 and Figure 14. The p values are above 0.05 for each polymorphism indicating that there are no statistically significant differences between Case and Control I groups (Figure 12), except the rs1045642 for ABCB1/MDR1 gene, where the p value for the genotype association test is exactly 0.05.
Figure 12.Genetic association tests (‘per-Genotype’, ‘per-Allele’ and for linear trend) between transplant patients with and without acute rejection events (Case vs Control I group).
Figure 13.Genetic association tests (‘per-Genotype’, ‘per-Allele’ and for linear trend) between all transplant patients and healthy individuals (Case + Control I vs Control II group).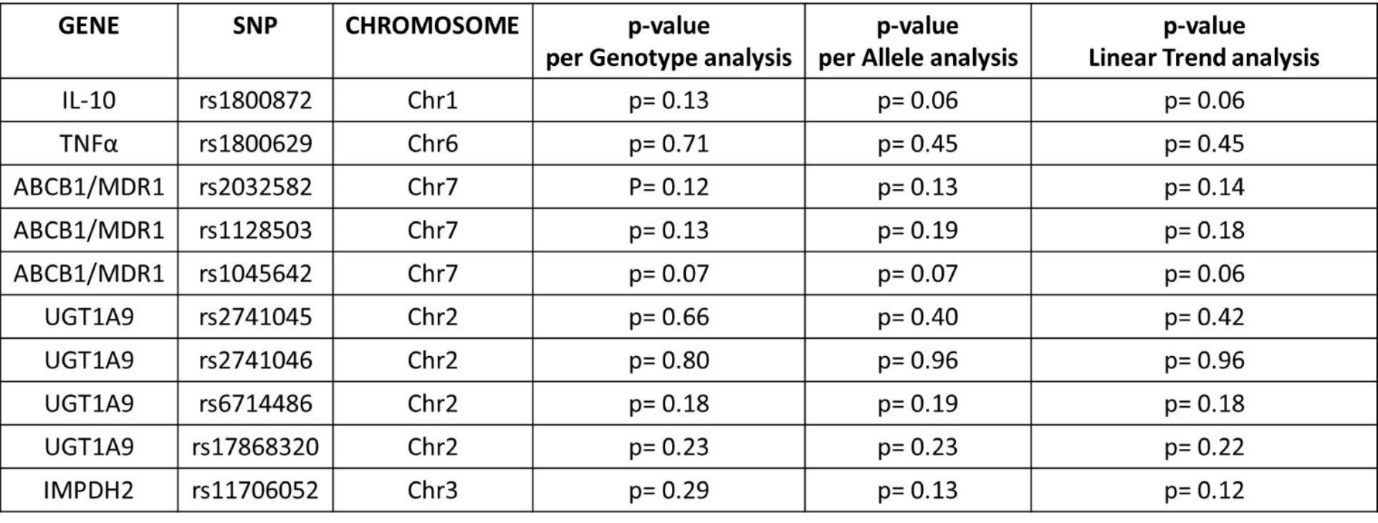
Figure 14.Genetic association tests (‘per-Genotype’, ‘per-Allele’ and for linear trend) between transplant patient with acute rejection events and healthy individuals (Case vs Control II group).
Comparing all transplant recipients (Case + Control I) and healthy individuals (Control II), G allele at rs1800872 positions of the IL10 gene may indicate an increased probability (p=0.06) to develop end stage kidney disease that requires renal transplantation as a final solution (Figure 13).
Since patients currently without acute rejection events may have acute rejection episodes in the future we also compared Case to Control II group (Figure 14). In the ABCB1/MDR1 gene by all three types of association tests rs1045642 (per-genotype p=0.01, per-allele p=0.01, trend test p=0.01) and rs2032582 (per-genotype p=0.02, per-allele p=0.03, trend test p=0.04) seem to be significant factors linked to AR after kidney transplantation. In addition, G allele variants of rs1800872 in IL10 are more characteristic to kidney transplant patients with acute rejection events than to healthy persons (per-allele p=0.03, trend test p=0.03).
Discussion
The examined genes and analyzed SNPs are involved also in acute rejection episodes following different types of organ transplantations, thus we believe that our results would be of interest not only to the experts in kidney transplantation but to all clinicians working for transplantation teams.
Characteristic SNP patterns of genes involved in immune responses and in the pharmacokinetics/pharmacodynamics of immunosuppressive drugs related to acute renal rejection episodes are in the focus of our on-going study. In this paper we present our preliminary results about the complex SNP profiles of kidney transplant recipients, highlighting some important genetic variants predisposing to acute rejection events. However, these findings should be considered as observations rather than statistical conclusions due to the modest number of transplant patients with acute rejection episodes in the Case group (The low number of patients with acute rejection events, in clinical aspects, is a success.) Therefore, we continue our study involving new patients also from other centers.
The age and gender composition of the three experimental groups were statistically different. Healthy people, without any known or generally checked diseases in the control II group were little younger than in the two other groups due to technical issues. In addition, more male patients needed transplantation than female patients. The literature supports the male prevalence of Chronic Kidney Disease (CKD) 9. This gender difference is also noted when acute rejection happens. Hence the gender composition in the Control II group was chosen to be similar to the other groups, rather than to be almost equal between males and females.
The observed allele frequencies in the Control II group are in line with ones reported from Europe indicating that the studied population is representative.
All SNPs for IMPDH2, with the exception of rs11706052, seem not to be polymorphic since only one allele was found with the sequencing analysis. Other groups have published similar results 10, 11 hypothesizing that those SNPs, found also in public, online databases (Entrez, Ensembl) are artefacts of previous, not so accurate sequencing techniques. Thus, these SNPs were removed from further analysis.
The genotype distribution of the experimental groups partially overlaps. However, no transplant patient with acute rejection is A/T heterozygote for rs2032582 of ABCB1/MDR1; and no healthy individuals are A/T or A/G heterozygote for rs2032582 of ABCB1/MDR1. No individuals in the Control I and II groups were G/G homozygote for rs11706052 of IMPDH2.
In the study population all examined polymorphisms are in Hardy-Weinberg equilibrium (HWE), except the rs1045642 of ABCB1/MDR1 in the Case group. Since HWE is violated, statistical methods using allele frequencies may not be valid and methods that use genotype frequencies are preferred 7, therefore both allele and genotype frequencies were calculated and used for further gene-disease association analysis.
The genetic associations calculated per allele, genotype and linear trend test do not verify statistically significant differences between all transplant patients (Case + Control I) and healthy controls (Control II). However, comparing Case and Control I groups, the rs1045642 of ABCB1/MDR1 gene has the p value equal to 0.05 and might be biologically significant. If more patients with acute rejection will be enrolled in the Case group it is very likely that the p value become also statistically unambiguously significant.
Excluding future candidates of rejection events by comparing Case to Control II group, statistically significant differences appear for one SNP of IL-10 and two SNPs of ABCB1/MDR1 gene; meaning that having a G in rs1800872 or a C in rs1045642 or an A in rs2032582 respectively, is a risk for the patients to develop an adverse event after transplantation.
Among the transplant recipients 2 patients are having the risky genotype so far without any rejection event. Therefore in this follow-up period the Control I group is still continuously monitored.
Certain SNPs - like rs1800872 - in the IL-10 gene promoter may influence the binding of several transcription factors and thereby gene expression. Since IL-10 is an anti-inflammatory cytokine, one may suppose that an SNP leading to a reduced expression may enhance inflammation in the target tissues. These speculations had tried to be verified by various studies: association tests on relatively homogeneous population 13 and smaller meta-analysis 14 showed a possible connection between IL-10 gene polymorphisms and acute graft rejection following renal transplantation, but large meta-analysis like by Xiong J et al 15 failed to support these findings.
ABCB1/MDR1 is coding for P-glycoprotein (P-gp), acting as an ATP-dependent pump, exporting drugs out from the cells and thereby reducing drug accumulation within the cells, thus preventing toxicity 10,11,12,13,14,15,16. Immunosuppressive agents, like calcineurin inhibitors are substrates of P-gp, therefore SNPs like rs1045642 and rs2032582 in ABCB1/MDR1, by modifying the effectiveness of the immunosuppressive drugs may put patients at a higher risk to reject the organ. This finding is in line with a previous study about lung transplantation 17, where the C allele of rs1045642 affecting P-gp function was considered as a risk allele – exactly like in our research. We can hypothesize that the change in the codon but not in the corresponding amino acid is influencing the effectiveness of the pump by for eg. post-transcriptionally modifying (via miRNA binding) the amount of mRNA and thereby the quantity of the expressed protein. In case of the gene polymorphism rs2032582 of ABCB1/MDR1 the A allele is coding for a missense mutation that can directly affect the quality and also the quantity of P-gp protein expression. However, no studies yet reported molecular mechanisms behind the differences in genotype and the belonging phenotype so further analysis should be done to confirm these theoretical suppositions.
Since blood levels of immunosuppressants vary between patients, several studies had been investigating the association of drug levels with different ABCB1/MDR1 polymorphisms. So far in European cohorts neither the influence of specific rs1045642 genotype on Tacrolimus pharmacokinetics were shown 18, nor out of target range Tacrolimus blood concentration were found to be associated with rs1045642 or rs2032582 in kidney recipients 19. However, six months following lung transplantation CT variant carriers of rs1045642 in ABCB1 had significantly higher blood Tacrolimus concentrations than CC carriers 20. Therefore also drug blood levels and their associations with the success of the immunosuppressive therapy will be examined in our extended study.
P-gp expressed also in the luminal site of kidney tubular cells and contributes to the active secretion of drugs 21, thus also the role of SNPs in living 22 and deceased 23 donor kidneys was evaluated in some studies, mostly with contradicting results about which genotype can be linked to allograft function and outcomes 24, 25. Donor polymorphisms and their interference with the genetic background of the recipients have not yet been concluded in this study.
Conclusion
Analysis of allele and genotype frequencies and gene-disease association tests showed that patients are more prone to have acute rejection events with specific alleles for SNPs rs1800872 of IL-10, and rs1045642, rs2032582 of ABCB1/MDR1. Consequently, certain allele variants by modifying immune responses or the effectiveness of the drugs may compromise the success of the immunosuppressive therapy and put patients at higher risk to reject the new organ.
Based on our results, especially male patients with a G allele in the promoter region of the IL-10 gene, a C allele at rs1045642 and an A allele at rs2032582 in the coding region of the ABCB1/MDR1 gene have more frequently acute rejection episodes. Therefore screening for these polymorphisms before transplantation would help clinicians to more accurately personalize medications to maximize immunosuppression and minimize toxicity.
References
- 4.Brenner, Rector’s. (2000) Clinical aspects on kidney transplantation. , Philadelphia:W.B.Saunders Company. The kidney, 6 Ed 2, 1145.
- 6.Genvigir F D, Salgado P C, Felipe C R, Luo E Y, Alves C. (2016) Pharmacogenet Genomics. 26(10), 462-72.
- 10.Baldelli S, Merlini S, Perico N, Nicastri A, Cortinovis M. (2007) . , Pharmacogenomics 8(9), 1127-41.
- 14.Thakkinstian A, Dmitrienko S, Gerbase-DeLima M, McDaniel D O, Inigo P. (2008) . , Nephrol Dial Transplant 23, 3017-3023.
- 17.H X Zheng, Zeevi A, McCurry K, Schuetz S, Webber S. (2005) . , Transplant Immunology 14(1), 37-42.
- 18.Kurzawski M, Dąbrowska J, Dziewanowski K, Domański L, Perużyńska M. (2014) . , Pharmacogenomics 15(2), 179-88.
- 19.Tavira B, Gómez J, Diaz-Corte C, Suarez B, Coronel D. (2015) . , Clin Chem Lab Med 53(10), 1515-9.
Cited by (7)
This article has been cited by 7 scholarly works according to:
Citing Articles:
C. Politi, S. Roumeliotis, G. Tripepi, B. Spoto - Life (2023) Semantic Scholar
Healthcare (2021) Crossref
Healthcare (2021) OpenAlex
F. Previtera, S. Restaino, G. Romano, Giuseppe Vizzielli, Andrea Neri et al. - Healthcare (2021) Semantic Scholar
Diagnosis (2019) Crossref
Diagnosis (2019) OpenAlex
Andrea Neri, E. Scalzotto, V. Corradi, C. Caprara, A. Salin et al. - Diagnosis (2019) Semantic Scholar
Journal of Organ Transplantation (2017) OpenAlex