
Abstract
Diabetes is a metabolic disorder that results in human body due to insulin deficiency, insulin resistance or both. In the management of diabetes, glucose monitoring technology has been used for the last three decades. The aim of this review article is to describe concise and organized information about different techniques of non-invasive continuous blood glucose monitoring. Many research groups have been working to develop wearable sensors for continuous blood glucose monitoring, but at present, there are to our knowledge no commercially successful non-invasive glucose monitors on the market. To achieve an acceptable sensor system, a glucose sensor should have accuracy better than 15mg/dl (0.8 mmol/l). In future development, continuous glucose sensor systems may become predictable, selective, reliable and acceptable for patient use.
Author Contributions
Academic Editor: Liang Liu, Wake Forest School of Medicin
Checked for plagiarism: Yes
Review by: Single-blind
Copyright © 2016 Asmat Nawaz, et al
 This is an open-access article distributed under the terms of the Creative Commons Attribution License, which permits unrestricted use, distribution, and reproduction in any medium, provided the original author and source are credited.
Competing interests
The authors have declared that no competing interests exist.
Citation:
Introduction
The main carrier of energy in human organism is glucose with recommended level between 88mg/dl (4.9mmol/l) – 125mg/dl (6.9mmol/l) 1,2. There is a direct connection between glucose and insulin in the human body. Insulin is secreted by pancreas, and is responsible for keeping the blood glucose at a healthy level. After meal intake, food is converted into glucose and then released into the bloodstream. Insulin helps to transport glucose from bloodstream into cells, and used as an energy source 2. Diabetes is a metabolic disorder that results in human body due to insulin deficiency, insulin resistance or both 3,4,5. There are commonly two types of diabetes, type 1 and type 2. In type 1, the body does not produce enough or no insulin, called insulin dependent type. In type 2, the ability of body to produce insulin does not completely disappear, but the human body becomes resistant towards insulin, called insulin-independent type 6,7. Any kind of diabetes can be harmful because in the long run excess of glucose (hyperglycemia) can cause multiple health problems such as heart strokes, birth defects, damaged nerve system, kidneys failure and blindness. Low level of glucose (hypoglycemia) can cause coma, confusion and even death.
The Diabetes Control and Complications Trial (DCCT) was a major clinical study conducted from 1983 to 1993 and funded by the National Institute of Diabetes and Digestive and Kidney Diseases. The study showed that keeping blood glucose levels as close to normal as possible slows the onset and progression of the eye, kidney, and nerve damage caused by diabetes. It demonstrated that any sustained lowering of blood glucose, also called blood sugar, helps, even if the person has a history of poor control 8. In 1985, it was estimated that 30 million people had diabetes around the world, the figure rose up with 150 million in 2000 and at the end of 2012 International Diabetes Federation (IDF) estimated that 371 million people had diabetes, and this number will increase to 552 million in 2030 9.
Figure 1 shows different classification of blood glucose measurements: invasive, minimally invasive and non-invasive 10. Invasive method is known as Finger-pricking method. It has several disadvantages. Most of people do not like using sharp objects and seeing blood, there’s a risk of infection, and, over the long run, this practice may result in damage to the finger tissue 11. The minimally approaches are developed by using subcutaneous sensors for the measurement of glucose concentration in interstitial fluid (ISF). However, they suffer from limitations in terms of discomfort to patients, continuous calibration requirements, and high susceptibility to biofouling 12.
Figure 1.Different classification of blood glucose measurement 15.
In vivo non-invasive (NI) blood glucose monitoring is a technique for the determination of glucose without taking blood sample. It can be inexpensive as compared to the invasive method that requires a fresh test-strip for each glucose measurement 13. Most of the researchers have been concerned by the idea of the different methodologies of non-invasive devices for the determination of blood glucose; permit more frequent testing and tighter control of diabetes. A non-invasive measurement of the blood glucose is based on the ability of glucose molecule to interact with different physical or chemical processes happening in the body. Nevertheless, in spite of some encouraging results have been shown over the past 40 years, but at present, there are to our knowledge no commercially successful non-invasive glucose monitors on the market 14.
Non-invasive monitoring can be characterized into the following two major categories; (i) optical methods (ii) transdermal methods. In the transdermal methods, physical energy is used to access interstitial fluid (ISF) or blood and extract glucose values. However, this method can change the skin properties and may cause blistering, irritation and erythema. On the other hand optical methods use light to access glucose molecule in ISF, blood or in anterior chamber of eye 15.
Interstitial Fluid
Interstitial fluid (ISF) is known as intercellular or tissue fluid having microscopic compartments around the cell. Glucose is freely moved from capillary endothelium to the ISF by simple paracellular and/or transcellular diffusion. The concentration of the glucose in ISF depends on rate of change of glucose concentration in blood, metabolic rate and blood flow rate 16, 17. There is a significant time difference (lag time) between 2 to 45 min in the peak glucose concentration of ISF and blood glucose, and the average lag time is 6.7min 15. This lag time is the sum of the physiological and instrumental lag. The instrumental lag rises from biographer’s measurement method and the physiological lag signifies the time requirements for the diffusion of blood glucose into the interstitial space from capillaries 18. The major challenge for the measurement of blood glucose non-invasively is the physiological lag between ISF and blood glucose. This problem particularly relates with the spectroscopic technologies, which predominately probe ISF glucose, creating variations in the calibration of techniques in which blood glucose is used as reference 19. Lag means that the sensor must be recalibrated to a blood glucose value at fixed intervals. As hypoglycaemia and hyperglycaemia complications depend on the blood glucose so the disparity between ISF glucose and blood glucose may suggest that for closed-loop insulin delivery system ISF sensors are not ideally suitable. Further lag is encountered in the delivery and absorption of insulin for subcutaneous-subcutaneous closed loop system in which ISF is used to sense glucose and insulin is delivered subcutaneously 20, 21.
Sensor’s Accuracy
There are different sensors such as GlucoWatch, Diasensors, Apsire, Gluco-band, Gluco Track, Orsense, SugarTrac, Hitachi Ltd, etc., have been proposed for non-invasive continuous glucose monitoring. However, the accuracy of these sensors still suffers from environmental and physiological interferences 22. To achieve an acceptable sensor system, a glucose sensor should have accuracy better than 15mg/dl (0.8 mmol/l) and the concepts should be more robust towards environment-experimental setup conditions 23. There are many ways to find out the accuracy (correctness) and precision (degree of reproducibility) of a glucose sensor against standard reference methods. Different multivariate statistical calibration models are constructed such as: multiple linear regressions, artificial neural network (ANN), principle component regression (PCR), ride regression, partial least square regression (PLS), support vector mechanics (SVMs) to map the measured quantity to the glucose value. Clarke grid analysis and correlation co-efficient ‘r’ are typical measures for the assessment of the glucose sensor accuracy 24,25,26,27.
Data Presentation
The prediction performance of a non-invasive sensor is measured by the use of statistical analysis. However most of researcher and clinicians tend to use Clarke error grid analysis (EGA) which is a frequently method used for the assessment of the clinical accuracy of glucose monitor’s and for data presentation 13, 28. It shows the monitor estimated glucose level on the y-axis with respect to reference glucose value on the x-axis, difference between these values and clinical significance of this difference. This Clark error grid consist of five zones labelled as A, B, C, D and E as shown in Figure 2. Zone A is clinically accurate, zone B is clinically acceptable, zone C shows unnecessary treatment, Zones D fail to detect glucose level and zone E shows the erroneous results 15, 29. Two parameters are used for the quantification of the occurrence of data points in zones A and B: (i) r value which is the correlation between reference (true) glucose value and the non-invasive glucometer measurement. (ii) Percentage value of experimental data points which fall in zones A and B. A major drawback in Clarke’s error analysis is that the boundaries of the zones are not connected sequentially, which means that small change in glucose values stated by a sensor can easily be transferred from a correct value zone A to a critical zone D and vice versa. Despite of this drawback, it has widely been used in the assessment of the glucose sensor accuracy.
In 2000, Parke’s et al. suggested a new error grid Figure 2. It is based on the response of hundred diabetic patients. Unlike Clarke’s error grid, Parke’s error is separate for both Type-1 and Type-2 diabetes and zones boundaries are connected sequentially, preventing the glucose values falling from a corrected zone to a critical zone and vice versa. There are 95% data points which are clinically acceptable in Clarke’s error grid but in Parke’s error grid the rated is 98%. The major drawback is that this error grid is patient specific and is not universal for all continuous glucose sensors. 30, 31.
Evaluating a glucose sensor’s accuracy is not straight forward, because regression, correlation and error grid all provide static accuracy data, despite of time-based structure of the data. In 2004, Kovatchev et al. introduced a continuous glucose error grid analysis (CG-EGA). Unlike original EGA, the CG-EGA examines time-based characteristics of the continuous glucose sensor (CGS) information, evaluating sensor readings and pairs of reference as a process in time signified by a bidimensional time series and taking into account inherent physiological time lags. It consist of two components: (a) point error grid analysis (P-EGA) accesses the sensor’s accuracy based on the correct presence of blood glucose values and (b) rate error grid analysis (R-EGA) evaluates the sensor’s ability to measure the rate of blood glucose fluctuation and direction. The estimated values of rate and point precisions are then merged in a single accuracy assessment presented for each one of three preset blood glucose ranges: hypoglycaemia, euglycaemia and hyperglycaemia. R-EGA and P-EGA consist of five zones labelled as AR, BR, CR, DR and ER as shown in figure 3, having similar clinical meaning to the original EGA 32.
Figure 2.Glucose sensor error grids: (A) Clarke error grid 15 and (B) Parkes error grid (Published with permission) 31.
Figure 3.Continuous glucose error grid analysis (CG- EGA): (A) rate error grid analysis R-ECA and (B) point error grid analysis P-EGA ( Published with permission) 32.
The purpose of this review is to discuss different techniques for non-invasive glucose monitoring based on optical methods in the visible and infrared ranges. This article covers history, principle, instrumentation, accuracy, merits and limitations of each technique.
Optical Methods for Non-Invasive Blood Glucose Measurement Techniques
Optical methods for non-invasive blood glucose measurement involve a selected band of electromagnetic radiations. After propagation through the tissue, these radiations interact with the components of tissues including glucose. The concentration of the glucose within the sampled tissue volume is analyzed by the spectrum, collected during propagation of light. In the non-invasive glucose sensing, selectivity is one of the most important parameter 33. Selectivity means to determine a particular amount of analyte in a complex matrix without any interference of other compounds. In order to over-come the effect of interfering interactions, a number of selectivity generating steps (detection and multistage separation principles) are used frequently, and the response is based on the interactions which are mostly accessed by multivariate data analysis (chemometrics) 34. In optical methods of glucose detection, sensor selectivity is a critical issue because a large numbers of metabolites are present in the human body which have similar optical signature as glucose 30. When accessing the selectivity, a suitable mathematical modelling should be incorporated 35. In different multivariate calibration models, selectivity issues have been explored and due to this, advances in non-invasive glucose sensing with different techniques are limited 36, 37. However, selectivity can be improved by the use of higher number of measurement, (e.g., use of whole spectrum over wave length range and the spectral data is processed by different chemometrics methods) 34.
Infrared (IR) Spectroscopy
Infrared (IR) spectroscopy technique induces rotational and vibrational transitions, associated with chemical bonds within or between molecules. Each molecular bond of molecules vibrates, so dipole moments fluctuate, and, this fluctuation interacts with the electric field of the incident radiation. If the molecular rotational or vibrational frequency matches with the striking radiation’s frequency then results in absorption, which is an energy transfer from light to heat. The magnitude and number of the vibrational modes are dependent on the configuration and number of atoms within a molecule. Each functional group of a molecule has a distinctive vibrational frequency that makes IR spectroscopy extensively used for identification of the molecular structure of samples. Spectral region based on IR range extends from 750nm-14,000nm and classified into three regions: Near Infrared (NIR), Mid Infrared (MIR) and Far Infrared (FIR). NIR and MIR are known as absorption spectroscopies and FIR known as thermal emission spectroscopy 15, 38, 39.
Near Infrared (NIR) Spectroscopy
Description
NIR spectroscopy was accepted as a technique in early 1960s with the work of Karl Norris of United States (Agriculture research service, Department of Agriculture) 40. After that, NIR spectroscopy expanded in many fields like food processing, pharmaceuticals, process control, remote imaging and many others applications 41. Recently many universities and industries use this approach in vivo glucose sensing for diabetes 42.
In the NIR spectroscopy, spectral region lying in the range of 750-2500nm, corresponds to overtone and combinations of fundamental vibrational transitions of (CH-OH-NH) groups 43. This spectral region (700-1100nm) known as therapeutic window, where intensities of melanin, water absorption band and hemoglobin are enough low so that the light can transmit into deep tissues with up-to 90-95% efficiency 15, 44, 45. Glucose has absorption peaks at 939nm, 970nm, 1197nm in the higher overtone region, 1408nm, 1536nm and 1688, 1925nm in the first overtone region and 2100nm, 2261nm, 2326nm in the combination region 46. It is based on colleting absorption or reflectance spectra of the tissue with a spectrophotometer. Due to the chemical interaction within the tissue, the focused light in the body is partially scattered and absorbed. Tissue properties and characteristics can be measured by light attenuation resulting from absorbance and scattering properties, 47, 48 described according to the light transport theory by equation I = I0, where I = transmitted light intensity, I0 = incident light intensity, d is the optical path length in tissue, and = (a, s), where s is the scattering coefficient and a is the absorption coefficient 22, 49. Changes in the glucose concentration can affect the measured absorption coefficient (a) of the tissue through changes in the absorption corresponding to water displacement or changes in its intrinsic absorption. The intensity of light which is scattered by the tissue is also affected by changes in glucose concentration. Changes in hydration status and temperature of the body might have an effect on water absorption bands and act as noise sources for glucose sensing 50.
A novel technique, named pulse glucometry, aims to get rid of, or minimizes the influences of contradictory factors by getting optical reading from a blood-only compartment within the tissue using by instantaneous differential NIR spectroscopy. This technique relies on two instant measurements over a tissue sample that is typically a finger’s tip. Changes in optical absorption between each measurement rely on a blood volume modification made by cardiac pulses. By a subtraction method, the interference of basal components is then separated. Pulse glucometry has been tested in humans showing promising results 51.
The proposed system consists of appropriate light source, optical fibers, photodiodes and different data processing techniques. Light returned from human tissue is collected by photo-diode through an optical fiber. NIR spectrometry measurement relates to several overlapping bands and so it needs multivariate calibration modeling. Classical statistical procedure method, partial least squares regression, support vector mechanics regression and artificial neural networks are used as multivariate analysis. Hence, aforesaid data processing techniques combined with the analysis of changes in the light intensity permits to extract the chemical components within tissue, including glucose and then finally display on the screen as shown in figure 3c52, 53. To check the clinical accuracy, the resultant regression was assessed by Clarke error grid analysis 27.
Figure 3c.Block diagram for proposed system 53.
Best site in the human body for glucose detection with NIR spectroscopy is forearm skin, earlobe, oral and lip mucosa, cheeks, tongue and nasal septum 52. Clinical results show that 75% of the measurement points fall in the A zones of Clarke error grid and rest are in the B zones as shown in figure 4 No data point are in other zones and the correlation coefficient between reference and non-invasive glucometer is equal to 0.85, which is very good 54.
Figure 4.Clarke error grid analysis based on NIR spectroscopy ( Published with permission) 54.
Merits/Limitations
It is very simple and inexpensive technique as compared to other optical methods, 55 having higher signal-to-noise ratio minimizes the interference from fluorescent light 56. It also allows to measure glucose concentration in deep tissues up to 1-100mm in depth 57. However, there are many disadvantages such as glucose absorption coefficient in NIR spectra is very low and it shows broad, weak and overlapped band with not only stronger bands of water but also with protein, fats and hemoglobin. Glucose concentration is also affected by different body parameters like variation in blood pressure, skin hydration, triglyceride, albumin concentration and body temperature 58. Environmental changes like humidity, atmospheric pressure and temperature could also affect the measured glucose values 42.
Mid Infrared (MIR) Spectroscopy
Description
MIR spectrum lies in the range of 2500-10,000nm. It has the same principle and proposed system as the NIR spectroscopy. Due to longer wavelength as compared to NIR, there is decrease in scattering and increase in absorption 38, 42. As a result, the MIR light only penetrates up to 100µm in human skin 38. Hence glucose has to be sensed in ISF of epidermis where blood capillaries are not reached 59. To overcome the limited light penetration problem due to the large absorption coefficients, a method called attenuated total reflection (ATR) is applied that uses a flexible hollow infrared optical fiber with a diamond (ATR) prism. Due to the nontoxicity of the hollow optical fiber, mechanical and chemical stabilities, flexibility and the diamond (ATR) prism, glucose level is expected to be measured in oral mucosa with high reproducibility 60,61, 62. Glucose concentration is measured by detectors with data processing technique such as partial least square regression 11. Best site in the human body for glucose detection with MIR spectroscopy is finger skin and oral mucosa 42.
Far Infrared (FIR) or Thermal Emission Spectroscopy
Description
It is based on thermal radiations in the range 8,000-14,000nm, naturally emitted from the human body having spectral information about tissue analytes 64. Glucose strongly absorbs energy in the wavelength range around 9,400nm 58. The proposed system detects the naturally emitted human body radiations especially from tympanic membrane 65. The information of this membrane is important because it shares the blood supply with hypothalamus, the center of core body temperature regulation 66, 67. The signals collected from this organ have smaller path length as compared to oral mucosa or skin site 15. It has identical selectivity principle as absorption spectroscopy has for analyte measurements 64.
The proposed system consists of speculum, used for insertion into ear with a plastic cover for hygienic purpose. For transmission of IR radiation, an optical system consists of IR wave-guide with an optional valve at the end of wave-guide that acts as shutter. Detecting system consists of optical filters and a thermopile detector, sensitive to an infrared (IR) region. One of the sensing components is shielded by an IR filter sensitive to the IR glucose signature. An appropriate filter that doesn't have spectral bands characteristic to the measured analyte, shields the other sensing space. Spectrally changed IR radiation from the membrane illuminates each window. The distinction between the intensities of the two radiation path ways provides a measure proportional to the analyte concentration. The information from the body temperature sensor, ambient humidity sensor, ambient temperature sensor and the analyte concentration is sent to the electronics system. Then all the signals are further sent to microcontroller for processing, and finally results of the estimated analyte concentration is displayed on the screen as shown in figure 552, 68, 69.
Figure 5.Proposed system for Thermal Emission Spectroscopy (Published with permission) 64.
An orthogonal regression calibration model is used for data analysis. To check the clinical accuracy, resultant regression was evaluated by Clarke error grid analysis which shows that 81% of the measurement points fall in the A zones of the Clarke error grid and rest are in the B zones as shown in figure 6. A very good correlation coefficient was found which is r = 0.89 64.
Figure 6.Clarke error grid analysis based on Thermal emission spectroscopy ( Published with permission) 64.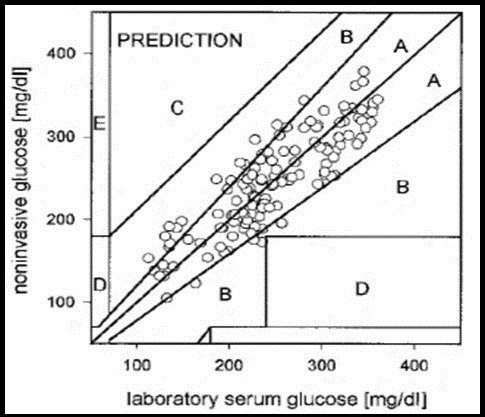
Merits/Limitations
One of the advantages of this technique is there is no requirement for individually daily calibration. The drawback is that the intensity of radiations emitted from the tympanic membrane is affected not only by its temperature but also by its thickness 52.
Photoacoustic (PA) Spectroscopy
Description
Photoacoustic technique was first discovered in the19th century by Alexander Graham Bell. With the development of laser in 1970s, this technique became more prominent for the analysis of gases 70, 71.
The proposed system is shown in figure 7. It consists of laser diode, projection system, transducer, optical fibers, microcontroller and display 72. In this method blood glucose is excited with laser pulses for very short period ~ nano-seconds 73. After the absorption of optical energy into cells, there is localized heating of PA cells which leads to volumetric expansion that means there is generation of acoustic wave, detected by confocal piezoelectric transducer 74, 75, 76. The measured acoustic wave provides information not just only about the amount of glucose but also the total incident energy 77. Glucose detection with this method is based on measuring the changes of peak-to-peak signal value which differs according to the glucose content 78. These PA cells are cavities closed by an optical window at one end and by skin surface at the other end. There are problems associated with these closed cavities, like pressure variation inside the cavity leading to the distortion of the PA signal and temperature rises inside the cavity due to lack of air circulation flow. To partly overcome these problems, a newly designed windowless resonator is used in the ultrasound frequency range (50-60 KHz), leading to higher signal-to-noise ratio. In addition, by using of windowless PA cell instead of the closed resonator, influences of temperature and pressure can be reduced and therefore increasing the stability 79. Best site in human body for PA spectroscopy of glucose is eye. Other sites are forearm and finger 42. There is no diabetic human trials with glucometer based on photoacoustic spectroscopy 30.
Figure 7.Experimental Photoacoustic set-up (published with permission) 72.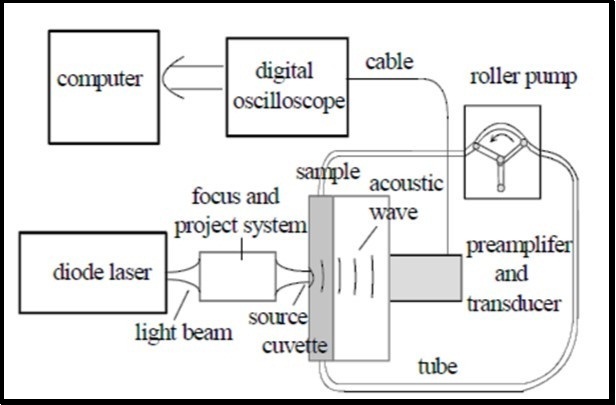
Merits/Limitations
It has higher detection sensitivity 11. The wide range in laser wavelength from Ultraviolet (UV) to Near Infrared (NIR) is suitable for PA spectroscopy 12. However, this technique is an expensive technique. It is affected by chemical interferences and is also sensitive to environmental changes like pressure, temperature and humidity 42.
Raman Spectroscopy
Description
Raman Effect was first discovered in 1928 by Chandrasekhara Ramanan. In 1970 with the development of laser this technique became prominent with spectroscopic applications 80.
It is based on the inelastic scattering of monochromatic light. Inelastic scattering means frequency of the photons is changed when it interacts with the sample/ human body. The frequency of re-emitted photons is shifted-up or down with respect to original laser light, called Raman Effect. This frequency shift gives information about rotational, vibrational or low frequency transitions 81, 82 in human fluids containing glucose. The scattered light is influenced by molecular vibration so glucose concentration in human fluids can be estimated 83.
The proposed system consists of four major components; Laser source, sample, spectrometer and detector. Figure 8 shows schematic illustration of Raman spectroscopy for forearm site. Laser beam passes through filter, lenses and mirrors and is then focused to the sample. Back scattered light from the body passes through notch filter for rejection of the specular component of the light. After that, filtered light goes to spectrometer and the spectra is collected by a CCD detector 84. Aqueous humor of the eye is also a good site for the detection of glucose because it contains a few Raman active molecules, which provide a measureable Raman signal. However, laser light wavelength should be low (700-900nm) to avoid toxicity 85,86,87. An improvement in this technique is achieved with the variations such as surface-enhanced Raman spectroscopy, stimulated Raman spectroscopy, coherent anti-stokes Raman scattering and resonance Raman spectroscopy 88. With this improvement higher intensity signals can be obtained 89. Partial least square regression (PLS) is used as a calibration model to estimate the concentration of glucose 83. Human trial shows a good correlation coefficient of r = 0.83 90.
Figure 8.Schematic illustration of Raman spectroscopy ( Published with permission) 91.
Optical Coherence Tomography (OCT)
Description
OCT was first demonstrated in 1991 by Fujimoto and co-workers. It is an emerging technique for performing cross-sectional imaging with high resolution in biological system 93, 94. It is based on Michelson interferometer with low coherence light source, fiber optics splitter, reference and scanning mirrors, lenses, photodetector and a display as shown in figure 9. Back scattered light from tissue is combined with light returned from the reference arm, detected by photodetector and then displayed on the screen 95, 96, 97, 98, 99. The delay correlation between the reflected light in the reference arm and backscattered light in the sample arm is measured 11. The idea of the mismatching refractive index between reference and sample indices has a potential application to measure the glucose level in blood both in vivo and vitro, using optical coherence tomography 100. The (OCT) technology allows to measure the glucose induced changes in skin directly from the dermis layer 101. Best site in human body for measurement of glucose concentration is forearm skin 22. To estimate the concentration of glucose, optical coherence tomography signal slop (OCTSS) was evaluated by linear least squares. Human trial shows good correlation coefficient of r = 0.8-0.95 30.
Figure 9.Optical coherence tomography system 95.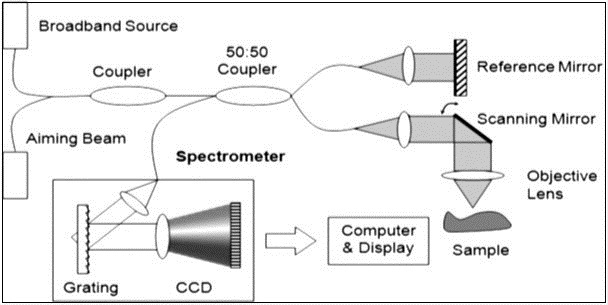
Merits/Limitations
It has high resolution with 1mm depth in the tissue 102 and high dynamic range (˃ 100dB) 103. The drawback is that the change in skin temperature of several degrees having significant effects on signals. Moreover, there is no clear indication that this technique has advantage over scattering techniques 22.
Metabolic Heat Conformation (MHC)
Description
In 1982 Heilsen et al showed that after the glucose injection into the human body, there is a change in temperature within two minutes. This study is the foundation of research related to metabolic oxidation of glucose named as MHC 104. In 2010, Zang et al proved that there is direct influence of glucose concentration with body temperature 105. The homeostatic circadian rhythm of human body is related to metabolic heat, oxygen supply and concentration of glucose. Hence, glucose concentration can be measured by following the conceptual equation.
GLU =F (heat generated, blood flow, Hb, HbO2)
Where GLU= glucose concentration, Hb= hemoglobin and HbO2= oxygenated hemoglobin 106, 107.
The glucose measurement device is based on sensor having three functions as shown in figure 10.
First function is to measure radiation temperature of the finger. A thermopile detector (D3) inside the sensor is used for this purpose. Second is to estimate blood flow rate which can be measured by temperature difference between thermistor D1 and D2 during contact of finger with the sensor. Third is the measurement of Hb and HbO2 with the help of diffuse reflectance spectroscopy. Multi-wavelength spectroscopy is done with six wavelengths (470, 535, 660, 810, 880, and 950 nm), that provides a reflectance spectrum for each of those measured substances and could then be converted to absorbance values via conversion formulas. Optical fibers lead light from the LEDs (L1-L6) to the individual’s fingertip and to the photodiodes (D5-D7). Photodiodes are organized to measure the reflective and also the diffuse reflection on the topmost, inside and through the skin surface 106, 108, 109, 110. If the perfusion (the process in which blood is delivered to the capillary bed in its biological tissue) is calculated with this technique then accuracy of glucose concentration could be increased 111. To estimate the glucose concentration, regressions are applied stepwise and a calibration function is performed. To evaluate clinical accuracy of these regression analysis, Clarke error grid analysis is used that shows 90% of the measuring points fall in the A zones and 10% in the B zones. No measuring points fall in other zones. This shows a very good correlation coefficient of r = 0.91, as shown in figure 11.
Figure 10.Sensor set-up (Published with permission) 106.
Figure 11.Clarke grid analysis based on MHC (Published with permission) 106.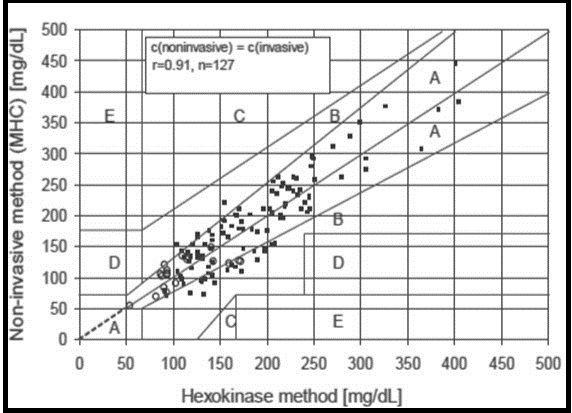
Fluorescence Technique
Description
This technique was first introduced for the detection of glucose in 1984 112, and it was further enhanced with the development of fluorescence resonance energy transfer (FRET) system, which means energy is transferred between two flourophore molecules if they are closer than the Forstre radius (the maximum distance over which energy transfer exist) 113, 114. Figure 12 shows schematic illustration of the fluorescence technique. When ultraviolet laser light of wavelength 380nm falls on human tissue, then fluorescence is generatesd by the human tissue. The reflected light comprises of induced emission of light produced due to the interactions between the glucose molecules with water present in sample and the excitation light. A sensor detects this reflected light and generates signals indicative of the intensity of reflected light associated with glucose concentration distinctive characteristics of the emission light. To evaluate glucose concentration in the sample, partial least square regression (PLS) is used. 22, 115, 116. Fluorescence based contact lenses based on polymer film have been developed for the detection of glucose concentration in tears. These contact- lens based sensor has been receiving a great attention because the device is disposable and portable. These contact lenses can change color according to the concentration of the glucose. Moreover, hydro-gel based soft lenses are safe for daily wear in diabetic patients 117, 118.
Figure 12.Schematic diagram of non-invasive glucose monitoring probe. Copyright © 2007, © SAGE Publications 121.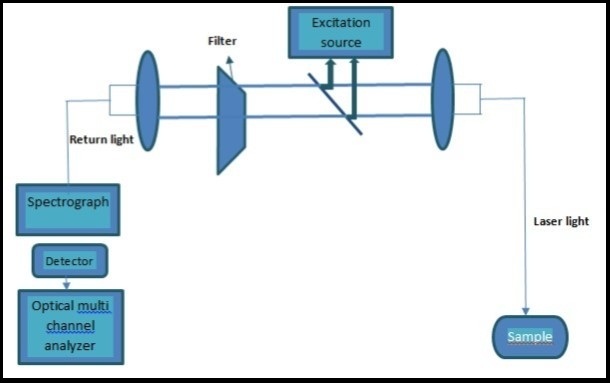
Merits/Limitations
It is an extremely sensitive technique. Single molecule detection can be achieved by the fluorescence method and there is little or no damage to the human body 119. It has also some limitations such as Ultraviolet light suffers strong scattering phenomena and fluorescence depend on several parameters of the skin such as redness, pigmentation and thickness 120.
Occlusion Spectroscopy
Description
Occlusion spectroscopy is based on light scattering phenomena. There is an inverse relationship between glucose concentration and scattering which leads to shorter optical path and less absorption. Figure 13 shows schematic diagram of non-invasive glucose monitoring probe 121, 122.
Figure 13.Schematic diagram of non-invasive glucose monitoring probe. Copyright © 2007, © SAGE Publications 121. 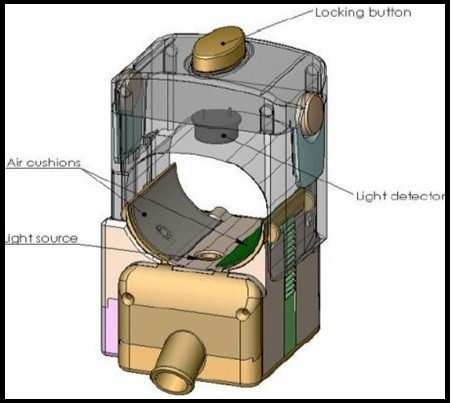
In this technique, pressure is applied by using pneumatic cuff to cease blood flow for few seconds. This pressure induces a pulse inside blood or changes the blood volume. At the same time, light is passed to the sample and the transmitted light is detected by a detector which estimates the glucose concentration. This temporary cessation of blood flow in human body (finger’s root) enhances the generated signal; thereby improving the signal-to-noise ratio. This dynamic signal enhances the sensitivity to glucose and the robustness to interferences, which results in a more accurate glucose measurement. Best site for glucose detection in human body for occlusion spectroscopy is finger’s root 123,124,125. Deming regression analysis was used to evaluate the glucose concentration. Furthermore, to check the accuracy of the regression analysis, a Clarke error grid analysis was used. It showed that 69.7% of the measuring points fall in the A zones and 25.7% in the B zones as shown in figure 14121.
Figure 14.Clarke grid analysis based on Occlusion spectroscopy. Copyright © 2007, © SAGE Publications 121.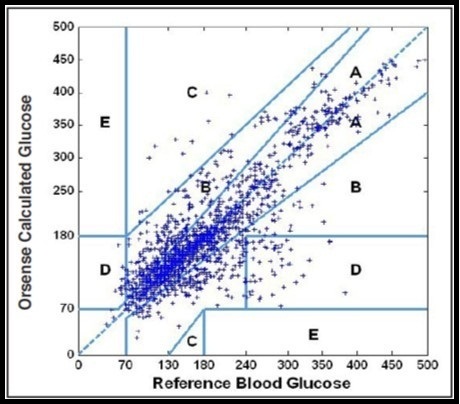
Kromoscopy
Description
Kromoscopy was first developed by Optix Corp 13. It is a multi-channel, real time correlated method with a series of overlapped broad band-pass filters for the determination of selective quantification of analyte, such as glucose127. Selectivity of a four-channel kromoscopic signal is demonstrated by the resolution of glucose information collected over 800-1300nm NIR spectra 128. In this technique, IR radiations are passed through the sample and transmitted light evenly divided into four detectors having band pass filters as shown in figure 15. These four detectors are arranged in such a way that the light reaching each detector has examined the same structures in the tissue. To evaluate target analyte such as glucose from interferents, a complex vector analysis is used. In vitro glucose and urea is successfully differentiated in a binary mixture 129, 131.
Figure 15.Schematic illustration of Kromoscopy (Published with permission) 129.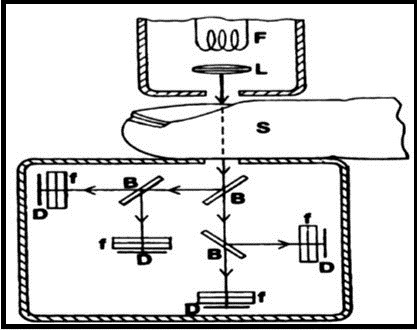
Multisensor Technology
Description
Multisensor data fusion technology consists of the combination of different sensors within the same device for the detection and compensation of those perturbations which are responsible for non-accuracy of the non-invasive sensor 132. To get multisensor technology, one approach is by combining two techniques such as bioimpedance/dielectric spectroscopy and absorption spectroscopy. Bioimpedance measurements include electrodes of different geometries and shapes, different frequency ranges such as from KHz to GHz, as well as optical modules (MIR spectroscopy), humidity, temperature sensor and an accelerometer 133. These sensors allow the measurement of exogenous (humidity, temperature, etc.) as well as endogenous (sweating, movement, skin perfusion, etc.) 132.
Figure 16 shows the schematic illustration of multisensor system, having electrodes of dielectric sensor and optical diffuse reflectance sensor. The two identical diffuse reflectance sensors are used for the measurement of optical properties of the skin. Dielectric properties of the skin are studied in three frequency regions: low frequency (kHz) sensor, high frequency (MHz) sensors and even higher frequency microwave (GHz) sensors. The dielectric capacitive fringing field sensors are used to measure the dielectric changes of skin and the underlying tissue within the frequency range 134.
Figure 16.Schematic illustration of the multisensor system, having electrodes of dielectric sensor and optical diffuse reflectance sensor (Published with permission) 134.
To estimate the glucose value from the multisensor technique, a suitable calibration model is needed. Usually partial least square regression is used for the estimation of model parameters from a suitable set of information. To check the clinical accuracy of the resultant regression, a Clarke error grid analysis is used. Figure 17 shows that Clarke A+B values are 89%. The correlation coefficient between reference and non-invasive glucometer is equal to 0.87, which is very good 23, 132, 134.
Figure 17.Clarke error grid analysis based on multisensor technology (Published with permission) 134.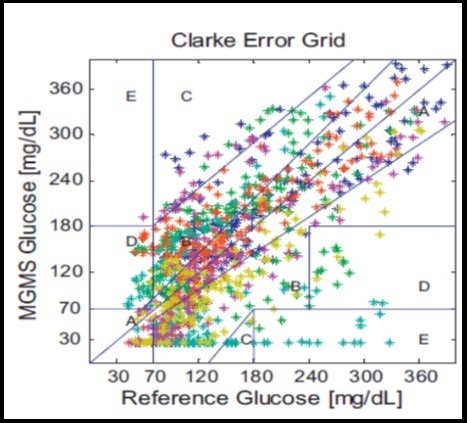
Another approach for multisensor technology is by combining three techniques such as ultrasonic, thermal and electromagnetic. Figure 18 shows Gluco-Track glucose monitor, developed on the basis of such combined technology. It consists of a main unit (MU), which drives three different sensor pairs located at the tip of personal ear clip (PEC) 135. The thermal channel consists of a sensor and a heater located on the ear clip in close juxtaposition to the ear lobe. The electromagnetic channel consists of the capacitor plates located on the opposing portion of the ear clip and the ear lobe works as a dielectric. The ultrasonic channel consists of piezo elements located on the opposing portion of the ear clip and thus opposite sides of the ear lobe 136.
Figure 18.(A) MU with PEC and (B) Side view of PEC. Copyright © 2010, © SAGE Publications 135.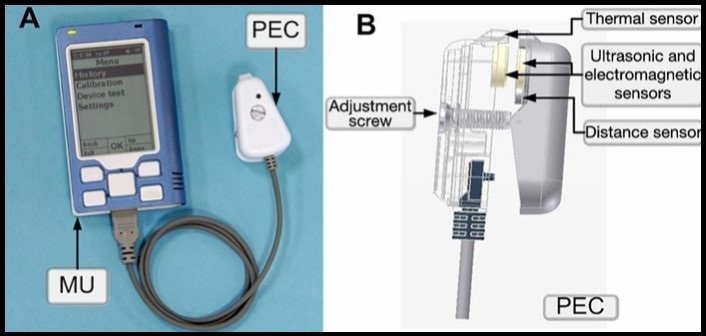
A calibration model such as partial least square regression is used to predict the glucose values. To estimate the clinical accuracy of the resultant regression, a Clarke error grid analysis is used. Figure 19 shows that 94% measurement data points fall in Clarke A+B zones.
Figure 19.(A) raw glucose readings per each technology (•) electromagnetic; (•) thermal; (•) ultrasonic and (B) final combined glucose result. Copyright © 2010, © SAGE Publications 135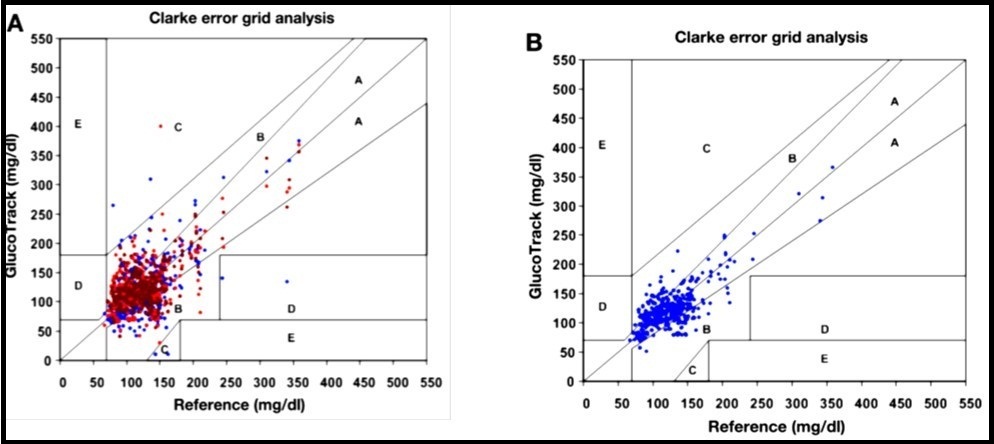
Merits/Limitations
The combination of different techniques decreases the errors resulting from each technique separately, thereby increasing the final result’s accuracy. However, from a practical approach, increasing the number of sensors or methods may cause the device to be more complex.
Table 1. The following table shows the over-view of the status and websites of companies, working on different non-invasive continuous blood glucose monitoring techniques by using different target sites of the human body 111222730425464135137.| Technology | Company/ Device | Target Site | Technique regarding accuracy | Environment Factors | URL |
| Ultrasonic, electromagnetic and thermal technology | Gluco-Track | Ear-lobe skin | 94% | Temperature and humidity sensitive | www.integrity-app.com |
| Fluorescence | Eye sense | Contact lens -tears | n/a | No effect | www.integrity-app.com |
| Occlusion spectroscopy | Orsense Ltd | Finger-tip skin | 69.7% | No effect | www.Orsense.com/Glucose |
| Raman spectroscopy | Medisensor | Skin | 83% | No effect | www.C8medisensor.com/us/home.html |
| Thermal emission spectroscopy | Infratec Inc | Tympanic membrane | 89% | Temperature sensitive | www.diabetesmonitor.com/meters.htm |
| Optical coherence tomography | Glucolight Corporation | Skin | 80-95% | Temperature sensitive | www.glucolight.com |
| Metabolic heat conformation | Hitachi Ltd | Finger-tip skin | 91% | Interference with environmental parameters | www.hitachi.com/news/cnews/040223.html |
| Bio-Impedance | Biosensors Inc | Wrist skin | 49% | Temperature sensitive | www.biosensors-tech.com |
| Photoacoustic spectroscopy | Glucon/Aprise | Forearm skin | 71% | Humidity, Pressure and temperature sensitive | www.glucon.com |
| Near infrared spectroscopy | LifeTrac system Inc/sugarTrac | Skin | 80-90% | Humidity, Pressure and temperature sensitive | www.sugartrac.com |
Summary and Conclusion
In this review, we have described the most important non-invasive blood glucose monitoring techniques. Most of them have been suffering from the same difficulties such as environmental factors (pressure, temperature and humidity) and physiological processes e.g., temperature variation, sweating and blood perfusion that acts as disturbing factors. None of the devices in the production meet the standards for an ideal sensor. Therefore, tremendous research efforts are required for the development of a reliable continuous glucose monitoring device that is wearable, portable, and unobtrusive. A major challenge is to differentiate weak glucose signals from the underlying spectral noise; thereby high signal-to-noise ratio is still required for all non-invasive techniques. It is very important that the spectral information due to the glucose is not disturbed by other components present in the blood or skin. The glucometer must be specific to the glucose concentration. Different multivariate statistical calibration models such as ANN, PLS, PCR, SVMs, are used to map the measured quantity to the glucose value. Signal-to-noise ratio can be improved by the use of digital filters with the above mentioned modeling techniques. Hence, it is necessary to give high attention towards calibration modeling. Calibrations is done by converting the raw data points (e.g., light intensity, response current) into useful glucose reading as well as compare these glucose values with the reference (true blood glucose) values.
Under laboratory conditions, it is relatively easy to measure data points and find correlation with blood glucose level as compared to normal environment. The challenge is to develop a stable and clinically reliable sensor which can continuously measure the glucose concentration with accuracy better than 15mg/dl (0.8mmol/l) in the normal environment of patient’s daily life. We are still far away from achieving this goal due to many technical issues. In order to handle all the aforementioned issues, the concepts should be more robust towards environment / experimental setup conditions together with multiple approaches from multidisciplinary research involving material scientists, chemists, pharmacists, engineers, and physicists.
We recommended that metabolic heat conformation (MHC) is feasible and low-cost method as compared to rest of the techniques, because of equipment which are used in this method is inexpensive and clinical results show a very good correlation coefficient of r = 0.91 as well. However, there is a need to concentrate on environmental effects as well as physiological processes in the human body. By combining MHC with some other techniques such as NIR spectroscopy (using sensor fusion technology), and providing additional information such as heart rate and body physical activity, one may be able to further improve the performance of non-invasive blood glucose sensor to a satisfactory level.
Acknowledgments
The project is jointly funded by Prediktor AS Norway, HBV Norway, Østfold Hospital Norway and Oslofjordfond Norway.
References
- 1.CE Ferrante do Amaral, Wolf B. (2008) Current development in non-invasive glucose monitoring,”. , Medical Engineering & Physics 30(5), 541-549.
- 2.Beebe R, Myers J. (2010) Paramedic Professional Medical Emergencies,Maternal Health & Pediatric..", second ed: Cengage Learning. 2, 324-336.
- 3.Wilkins E, Atanasov P. (1996) Glucose monitoring: state of the art and future possibilities,”. , Medical Engineering & Physics 18(4), 273-288.
- 5.J M Wojcicki, Ladyzynski P. (2003) Toward the improvement of diabetes treatment: recent developments in technical support,”. , J Artif Organs 6(2), 73-87.
- 6.Hanas R. (2010) Type 1 Diabetes in Children, Adolescents and Young Adults: How to Become an Expert on Your Own Diabetes,” sixth ed: Class Pub. 5-7.
- 7.D B Sacks, Arnold M, G L Bakris, D E Bruns, A R Horvath et al. (2011) . Guidelines and Recommendations for Laboratory Analysis in the Diagnosis and Management of Diabetes Mellitus,” Diabetes Care 34(6), 61-99.
- 8. (1993) The effect of intensive treatment of diabetes on the development and progression of long-term complications in insulin-dependent diabetes mellitus. , The Diabetes Control and Complications Trial Research Group,” N Engl J Med 329(14), 977-86.
- 10.Heinemann L, Schmelzeisen-Redeker G. (1998) Non-invasive continuous glucose monitoring in Type I diabetic patients with optical glucose sensors,”. , Diabetologia 41(7), 848-854.
- 11.So C-F, Choi K-S, T K Wong, J W Chung. (2012) Recent advances in noninvasive glucose monitoring,”. , Medical Devices (Auckland, NZ) 5, 45.
- 12.S K Vashist. (2012) Non-invasive glucose monitoring technology in diabetes management: a review,”. , Anal Chim Acta 750(0), 16-27.
- 13.O S Khalil. (1999) Spectroscopic and Clinical Aspects of Noninvasive Glucose. , Measurements,” Clinical Chemistry 45(2), 165-177.
- 14.Ciudin A, Hernandez C, Simo R. (2012) Non-Invasive Methods of Glucose Measurement:. , Current Status and Future Perspectives,” Current Diabetes Reviews 8, 48-54.
- 15.N S Oliver, Toumazou C, A E Cass, D G Johnston. (2009) Glucose sensors: a review of current and emerging technology,”. , Diabet Med 26(3), 197-210.
- 16.M S Boyne, D M Silver, Kaplan J, C D Saudek. (2003) Timing of changes in interstitial and venous blood glucose measured with a continuous subcutaneous glucose sensor,”. , Diabetes 52(11), 2790-4.
- 17.Cengiz E, W V Tamborlane. (2009) A tale of two compartments: interstitial versus blood glucose monitoring,”. , Diabetes technology & therapeutics 11(1), 11-16.
- 18.Kulcu E, J A Tamada, Reach G, R O Potts, M J Lesho. (2003) Physiological Differences. Between Interstitial Glucose and Blood Glucose Measured in Human Subjects,” Diabetes Care 26(8), 2405-2409.
- 19.Shao J, Lin M, Li Y, Li X, Liu J et al. (2012) In Vivo Blood Glucose Quantification Using Raman Spectroscopy,”. , PLoS ONE 7, 48127.
- 20.Renard E, Place J, Cantwell M, Chevassus H, Palerm C C. (2010) Closed-Loop Insulin Delivery Using a Subcutaneous Glucose Sensor and Intraperitoneal Insulin Delivery: Feasibility study testing a new model for the artificial pancreas,”. , Diabetes Care 33(1), 121-127.
- 21.Elleri D, Dunger D B, Hovorka R. (2011) Closed-loop insulin delivery for treatment of type 1. , diabetes,” BMC Med 9(9), 120.
- 22.Tura A, Maran A, Pacini G. (2007) Non-invasive glucose monitoring: assessment of technologies and devices according to quantitative criteria,”. , Diabetes Res Clin Pract 77(1), 16-40.
- 23.Caduff A, M S Talary, Mueller M, Dewarrat F, Klisic J et al. (2009) Non-invasive glucose monitoring in patients with Type 1 diabetes: a Multisensor system combining sensors for dielectric and optical characterisation of skin,”. , Biosens Bioelectron 24(9), 2778-84.
- 24.M A Arnold. (1996) Non-invasive glucose monitoring,”. , Current Opinion in Biotechnology 7(1), 46-49.
- 25.Nystrom J, Lindholm-Sethson B, Stenberg L, Ollmar S, J W Eriksson et al. (2003) Combined near-infrared spectroscopy and multifrequency bio-impedance investigation of skin alterations in diabetes patients based on multivariate analyses,”. , Med Biol Eng Comput 41(3), 324-9.
- 26.D J Cox, W L Clarke, Gonder-Frederick L, Pohl S, Hoover C et al. (1985) Accuracy of perceiving blood glucose. in IDDM,” Diabetes Care 8(6), 529-536.
- 27.Ogawa M, Yamakoshi Y, Satoh M, Nogawa M, Yamakoshi T et al.Support vector machines as multivariate calibration model for prediction of blood glucose concentration using a new non-invasive optical method named Pulse Glucometry,”. in proceedings of the 29th IEEE , Lyon, France,Aug23-26,2007 4561-3.
- 28.C Z Ming, Raveendran P, P S Chew.A comparison analysis between partial least squares and Neural Network in non-invasive blood glucose concentration monitoring system,”. in Proceedings of IEEE, Singapor,Dec 2-4,2009 1-4.
- 29.W L Clarke, Cox D, L A Gonder-Frederick, Carter W, S L Pohl. (1987) Evaluating clinical accuracy of systems for self-monitoring of blood glucose,”. , Diabetes Care 10(5), 622-8.
- 30.Vaddiraju S, D J Burgess, Tomazos I, F C Jain, Papadimitrakopoulos F. (2010) Technologies for continuous glucose monitoring: current problems and future promises,”. , Journal of diabetes science and technology 4(6), 1540.
- 31.J L Parkes, Slatin S L, Pardo S, B H Ginsberg. (2000) A new consensus error grid to evaluate the clinical significance of inaccuracies in the measurement of blood glucose,”. , Diabetes Care 23(8), 1143-1148.
- 32.B P Kovatchev, L A Gonder-Frederick, D J Cox, W L Clarke. (2004) Evaluating the accuracy of continuous glucose-monitoring sensors continuous glucose–error grid analysis illustrated by therasense freestyle navigator data,”. , Diabetes Care 27(8), 1922-1928.
- 33.M A Arnold, Liu L, J T Olesberg. (2007) Optical Non-Invasive Glucose Monitoring: Selectivity Assessment of Noninvasive Glucose Measurements Based on Analysis of Multivariate Calibration Vectors,”. , Journal of diabetes science and technology 1(4), 454.
- 34.Vessman J, R I Stefan, JF van Staden, Danzer K, Lindner W et al. (2001) et al.(2001) "Selectivity in analytical chemistry (IUPAC Recommendations2001),". , Pure and Applied Chemistry 73(8), 1381-1386.
- 35.Bro R. (2003) Multivariate calibration: What is in chemometrics for the analytical chemist?,”. , Analytica Chimica Acta 500(1), 185-194.
- 36.Singh P, Kaur H, Singh D K V P. (2013) Non-invasive Blood Glucose Level Measurement from LASER Reflected Spectral Patterns Images,”. , IOSR Journal of Engineering 3(8), 6-10.
- 38.Ren M. The University of Iowa (2007) Comparison of Near Infrared and Raman Spectroscopies for Noninvasive Clinical Measurements,” Phd thesis.
- 39.Kramer K E. University of Lowa (2005) Improving the robustness of multivariate calibration models for the determination of glucose by near-infrared spectroscopy,” Phd thesis.
- 40.Barton I. (2002) FE Theory and principles of near infrared spectroscopy,”. , Spectroscopy Europe 14, 12-18.
- 41.Schwanninger J C R M. (2011) K.Facklers, “A review of band assignments in near infrared spectra of wood and wood components,”. , J. Near Infrared Spectrocopy 19(5), 287-308.
- 42.G L Coté. (2001) Noninvasive and Minimally-Invasive Optical Monitoring Technologies,”. , The Journal of Nutrition 131(5), 1596-1604.
- 43.VTuchin V.Handbook of Optical Sensing of Glucose. in Biological Fluids and Tissues,” second ed:Taylor & Francis,2008,p 282.
- 44.Tsai C-L, Chen J-C, Wang W-J. (2001) Near-infrared absorption property of biological soft tissue constituents,”. , Journal of Medical and Biological Engineering 21(1), 7-14.
- 46.Yadav J, Rani A, Singh V, B M Murari.Near-infrared LED based non-invasive blood glucose sensor,”. in Signal Processing and Integrated Networks (SPIN), IEEE, Nodia,Feb20-21,2014 591-594.
- 47.H W Siesler, Ozaki Y, Kawata S, Heise H M. (2008) Near-Infrared Spectroscopy: Principles, Instruments, Applications,” third ed:Wiley. 6.
- 48.Kees G, Rennert J, Ruchti T. (2003) Non-invasive method of determining skin thickness and characterizing layers of skin tissue in vivo,” US6671542 B2,Dec30,2003.
- 49.V S Hollis. Medical Physics and Bioengineering, University College London (2002) Non-Invasive Monitoring of Brain Tissue Temperature by Near-Infrared Spectroscopy," Phd thesis.
- 50.R S Gad. Department of Physics, Goa University (2008) Instrumentation design for non-invasive blood analysis based on optical sensors,” Phd thesis.
- 51.Yamakoshi K, Yamakoshi Y. (2006) Pulse glucometry: A new approach for noninvasive blood glucose measurement using instantaneous differential near-infrared spectrophotometry,”. , J Biomed Opt 11(5), 054028.
- 52.Leal S C L A L. (2012) G.D.Assad, SO.M.Chapa, "State of the art and new perspectives in non-invasive glucose sensors,”. , Revista Maxicana de Ingenieria Biomedica 33(1), 41-52.
- 53.Kaur J, Kumar J, Sardana H, Bhatnagar R, Mehla N. (2009) Non Invasive Blood Glucose Measurement Using Optical Method: Feasibility Study And Design Issues,”. in Proceeding of International Conference on Optics and Photonics , Chandigarh, 30Oct-1Nov 1-4.
- 54.AMk Masab Ahmad, Khan Ahmed. (2013) Non-invasive blood glucose monitoring using near-infrared spectroscopy,”. , Medical Design Center, EDN Network 1-9.
- 55.Youcef-Toumi K, V A Saptari. (1999) Noninvasive blood glucose analysis using near infrared absorption spectroscopy,’ The home automation and healthcare consortium. Progress Report No. 2-3
- 56.C H Lam. (2008) Clinical Evaluation of Non-Invasive Blood Glucose Measurement by Using Near Infrared Spectroscopy via Inter and Intra-subject Analysis,” Phd thesis, The Hong Kong Polytechnic University.
- 57.Chowdhury A S M K, Sharma N. (2012) Challenges & Countermeasures in Optical Noninvasive Blood Glucose Detection,”. , International Journal of Innovative Research in Science, Engineering and Technology 2(1), 329-334.
- 59.Kottmann J M R J, Luginbul E Reichmann J, M W Sigrist. (2012) Glucose sensing in human epidermis using mid-infrared photoacoustic detection,”. , biomedical Optics Express 3(4), 667-680.
- 60.Kino S, Tanaka Y, Matsuura Y. (2014) Blood glucose measurement by using hollow optical fiber-based attenuated total reflection probe,”. , Journal of Biomedical Optics 19, 057010-057010.
- 61.H M Ishizawa, Takano A, Honda T. (2008) and HK Kanai.(2008) “Non-invasive blood glucose measurement based on ATR infrared spectroscopy,”. in Proceeding of SICE annual conference, IEEE , Tokyo, Japan,Aug20-22,Tokyo 321-324.
- 62.Yoshida S, Yoshida M, Yamamoto M, Takeda J. (2013) Optical screening of diabetes mellitus using non-invasive Fourier-transform infrared spectroscopy technique for human lip,”. , Journal of Pharmaceutical and Biomedical Analysis 76, 169-176.
- 63.Govada A, Renumadhavi C, K B Ramesh. (2014) Non-Invasive Blood Glucose Measurement,”. , International Journal of Advanced Research in Computer and Communication Engineering 3(1), 5122-5155.
- 64.C D Malchoff, Shoukri K, J I Landau, J M Buchert. (2002) . , A Novel Noninvasive Blood Glucose Monitor,” Diabetes Care 25(12), 2268-2275.
- 65.J M Buchert. (2004) Thermal emission spectroscopy as a tool for noninvasive blood glucose measurements,”. in Proceeding of SPIE, Optical Security and Safety,Aug 26,2004 5566, 100-111.
- 66.Gasim G, Musa I, Abdien M, Adam I. (2013) Accuracy of tympanic temperature measurement using an infrared tympanic membrane thermometer,”. , BMC Research Notes 6(1), 1-5.
- 67.Childs C, Harrison R, Hodkinson C. (1999) Tympanic membrane temperature as a measure of core temperature,”. Archives of disease in childhood 80(3), 262-266.
- 68.Buchert J. (2005) Thermal Emission Non-Invasive Analyte Monitor,” United state Patent US20050043630 A1,Feb.24.
- 69.J M Buchert. (1998) Non-invasive continuous blood glucose monitoring,”. United states Patent US5823966 A,Oct20 .
- 70.G B Christison, H A MacKenzie. (1993) Laser photoacoustic determination of physiological glucose concentrations in human whole blood. , Medical and Biological Engineering and Computing 31(3), 284-290.
- 71.J L Smith. (2006) The Pursuit of Noninvasive Glucose:“Hunting the Deceitful Turkey”, second ed. 44.
- 72.Zhao Z, R A Myllyla.Photoacoustic blood glucose and skin measurement based on optical scattering effect,”in. Proceeding of SPIE, Optical Technologies in Biophysics and Medicine III,Saratov,Russia,July16,2002,vol 4707,pp 153-157.
- 73.O C Kulkarni, Mandal P, Das S S, Banerjee S.A Feasibility Study on Noninvasive Blood Glucose Measurement Using Photoacoustic Method,”. in Proceeding of the 4th Bioinformatics and Biomedical Engineering, IEEE, Chegdu,June18-20,2010 1-4.
- 74.Ren Z, Liu G, Huang Z.Noninvasive detection of glucose level based on tunable pulsed laser induced photoacoustic technique,” in. Proc. SPIE 9297, International Symposium on Optoelectronic Technology and Application,Dec3,2014,vol: 9297 929707-929709.
- 75.CEF do Amaral. Technical University of Munich (2008) Multiparameter Methods for Non-invasive Measurement of Blood Glucose,” Phd thesis. Electrical engineering and Information Technology.
- 76.H A MacKenzie, H S Ashton, Spiers S, Shen Y, Freeborn S S et al. (1999) Advances in photoacoustic noninvasive glucose testing,”. , Clinical chemistry 45(9), 1587-1595.
- 77.M S Chou. (2000) Method and apparatus for noninvasive measurement of blood glucose by photoacoustics,” United state Patent,Apr 11,6,049-728.
- 78.Lee S, Nayak V, Dodds J, Pishko M, N B Smith. (2005) Glucose measurements with sensors and ultrasound,”. , Ultrasound in Medicine & Biology 31(7), 971-977.
- 79.M A Pleitez, Lieblein T, Bauer A, Hertzberg O, H von Lilienfeld-Toal et al. (2013) Windowless ultrasound photoacoustic cell for in vivo mid-IR spectroscopy of human epidermis: Low interference by changes of air pressure, temperature, and humidity caused by skin contact opens the possibility for a non-invasive monitoring of glucose in the interstitial fluid,” Review of Scientific Instruments. 84, 084901.
- 81.N C Dingari, Barman I, G P Singh, J W Kang, R et al. (2011) Investigation of the specificity of Raman spectroscopy in non-invasive blood glucose measurements,” Analytical and bioanalytical chemistry. 400(9), 2871-2880.
- 82.Hanlon E, Manoharan R, Koo T, Shafer K, Motz J et al. (2000) Prospects for in vivo Raman spectroscopy,”. Physics in Medicine and Biology 45(2), 1.
- 83.A J Berger, Koo T-W, Itzkan I, Horowitz G, M S Feld. (1999) Multicomponent Blood Analysis by Near-Infrared Raman Spectroscopy,”. , Applied Optics 38(13), 2916-2926.
- 84.Hunter M, Enejder A, Scecina T, Feld M, W C Shih. (2013) Raman spectroscopy for non-invasive glucose measurements,”. United state Patent US 8,355,767 B2,Jan15 .
- 85.Ergin A, Vilaboy M, Tchouassi A, Greene R, Thomas G.Detection and analysis of glucose at metabolic concentration using Raman spectroscopy,”. in Proceeding of the 29th Bioengineering Conference,March 22-23,2003,IEEE 337-338.
- 86.Ergin A, Thomas G.Noninvasive detection of glucose in porcine eyes,”. in Proceedings of the 31st Bioengineering Conference,April 2-3,2005,IEEE,Northeast 246-247.
- 87.J L Lambert, M S Borchert.Non-invasive glucose monitor,”. United state Patent US Jul23,2002. 6,424,850 B1 .
- 88.Pandey R, N C Dingari, Spegazzini N, Dasari R R, G L Horowitz et al. (2015) Emerging trends in optical sensing of glycemic markers for diabetes monitoring,”. , TrAC Trends in Analytical Chemistry 64, 100-108.
- 89.Kneipp K, Moskovits M, Kneipp H. (2006) Surface-Enhanced Raman Scattering: Physics and Applications,” first ed: Physica-Verlag. 1.
- 90.M J Scholtes-Timmerman, Bijlsma S, M J Fokkert, Slingerland R, Veen S J F van. (2014) Raman Spectroscopy as a Promising Tool for Noninvasive Point-of-Care Glucose Monitoring,”. Journal of Diabetes Science and Technology 974-979.
- 91.Enejder A M K, T G Scecina, Oh J, Hunter M, Shih W-C et al. (2005) Raman spectroscopy for noninvasive glucose measurements,”. , Journal of Biomedical Optics 10, 031114-0311149.
- 93.Huang D, E A Swanson, C P Lin, J S Schuman, W G Stinson et al. (1991) Optical coherence tomography,”. , Science 254(5035), 1178-81.
- 94.J G Fujimoto, Pitris C, S A Boppart, M E Brezinski. (2000) Optical coherence tomography: an emerging technology for biomedical imaging and optical biopsy,”. , Neoplasia(New York,NY),2(1-2) 9.
- 95.He R, Wei H, Gu H, Zhu Z, Zhang Y et al. (2012) Effects of optical clearing agents on noninvasive blood glucose monitoring with optical coherence tomography: a pilot study,”. , J Biomed Opt 17(10), 101513.
- 96.K V Larin, Motamedi M, T V Ashitkov, R O Esenaliev. (2003) Specificity of noninvasive blood glucose sensing using optical coherence tomography technique: a pilot study,”. Physics in Medicine and Biology 48(10), 1371.
- 97.M J Schurman, W J Shakespeare.Method and apparatus for monitoring glucose levels in a biological tissue,” United state PatentUS,Aug7,2007,7,254,429 B2.
- 98.A M Zysk, F T Nguyen, A L Oldenburg, D L Marks, S A Boppart. (2007) Optical coherence tomography: a review of clinical development from bench to bedside,”. , J Biomed Opt 12(5), 051403.
- 99.A F Fercher, Drexler W, C K Hitzenberger, Lasser T. (2003) Optical coherence tomography-principles and applications,” Reports on progress in physics. 66(2), 239.
- 100.Ullah H, Ahmed E, Ikram M. (2014) Monitoring of glucose levels in mouse blood with noninvasive optical methods,”. , Laser Physics 24, 025601.
- 101.Zhang Y, Wu G, Wei H, Guo Z, Yang H et al. (2014) Continuous noninvasive monitoring of changes in human skin optical properties during oral intake of different sugars with optical coherence tomography,”. , Biomedical Optics Express 5, 990-999.
- 102.Bazaev N, Y P Masloboev, Selishchev S. (2012) Optical methods for noninvasive blood glucose monitoring,”. , Biomedical Engineering 45, 229-233.
- 103.K V Larin, Akkin T, R O Esenaliev, Motamedi M, T E Milner. (2004) Phase-sensitive optical low-coherence reflectometry for the detection of analyte concentrations,”. , Applied optics 43(17), 3408-3414.
- 104.Kit S Y H, N M Kassim. (2013) Non-Invasive Blood Glucose Measurement Using Temperature-based Approach,”. , Jurnal Teknologi 64(3), 105-110.
- 105.Zhang X, C M Ting, J H Yeo.Finger temperature controller for non-invasive blood glucose measurement,”. in Proceeding of SPIE, Optics in Health Care and Biomedical Optics IV, Beijing, China,Oct18,2010 7845, 78452-78452.
- 106.O K Cho, Y O Kim, Mitsumaki H, Kuwa K. (2004) Noninvasive measurement of glucose by metabolic heat conformation method,”. , Clinical chemistry 50(10), 1894-1898.
- 107.Tang F, Wang X, Wang D, Li J. (2008) Non-Invasive Glucose Measurement by. , Use of Metabolic Heat Conformation Method,” Sensors 8(5), 3335-3344.
- 108.J B Ko, O K Cho, Y O Kim, Yasuda K. (2004) Body metabolism provides a foundation for noninvasive blood glucose monitoring,” Diabetes care. 27(5), 1211-1212.
- 109.Chen Z-c, Jin X-l, Zhu J-m, Wang D-y, Zhang T-t. (2009) Non-invasive glucose measuring apparatus based on conservation of energy method,”. , Journal of Central South University of Technology 16(6), 982-986.
- 110.MMJW Van Herpen, Balistreri M L M, Presura C.Glucose Sensor,” United state Patent ,Aug21,2008US20080200781A1.
- 111.Hristov L T a V. (2013) Non Invasive method for measuring blood glucose using MSP430x microcontroller,”. , Int. J. Open Problems Compt. Math 6(2), 1-9.
- 112.Mansouri S, J S Schultz. (1984) A miniature optical glucose sensor based on affinity binding. , Nature biotechnology 2(10), 885-890.
- 113.Eigner G, P I Sas, Kovács L.Continuous glucose monitoring systems in the service of artificial pancreas,”. in Applied Computational Intelligence and Informatics (SACI), 9th International Symposium on, IEEE, Romania,May15-17,2014 117-122.
- 114.Hsieh H V, D B Sherman, S A Andaluz, T J Amiss, J B Pitner. (2011) Fluorescence resonance energy transfer glucose sensor from site-specific dual labeling of glucose/galactose binding protein using ligand protection,”. , Journal of diabetes science and technology 6, 1286-1295.
- 115.W S Grundfest, Stavridi M.Glucose fluorescence monitor and method,”Unted state Patent,Aug30,1994.US5341805A.
- 116.W J Snyder, W S Grundfest.Glucose monitoring apparatus and method using laser-induced emission spectroscopy,” United statePatent,May15,2001,US6,232,609B1.
- 117.Zhang J, Hodge W, Hutnick C, Wang X. (2011) Noninvasive diagnostic devices for diabetes through measuring tear glucose,”. , Journal of diabetes science and technology 5, 166-172.
- 118.Badugu R, J R Lakowicz, C D Geddes.A glucose-sensing contact lens: a new approach to noninvasive continuous physiological glucose monitoring,”. in Proceeding of SPIE, Optical Fibers and Sensors for Medical Applications,June10,2004,5317 234-245.
- 119.J C Pickup, Hussain F, N D Evans, O J Rolinski, D J Birch. (2005) Fluorescence-based glucose sensors,” BiosensorsandBioelectronics,20(12). 2555-2565.
- 120.Sandby-Møller J, Poulsen T, Wulf H. (2003) Influence of epidermal thickness, pigmentation and redness on skin autofluorescence,” Photochemistry and photobiology. 77(6), 616.
- 121.Amir O, Weinstein D, Zilberman S, Less M, Perl-Treves D et al. (2007) Optical Non-Invasive Glucose Monitoring: Continuous Noninvasive Glucose Monitoring Technology Based on “Occlusion Spectroscopy”. , Journal of diabetes science and technology 1(4), 463.
- 122.Abdalsalam A-kMO Ola S, Roua M Abd-Alhadi, Saad D Alshmaa.Design of Simple Noninvasive Glucose Measuring Device,”. in Proceeding of Computing, Electrical and Electronics Engineering,IEEE,Aug26-28,2013,Khartoum 216-219.
- 123.Shinde A, Prasad R. (2011) Non Invasive Blood Glucose Measurement using NIR technique based on occlusion spectroscopy,”. , International Journal of Engineering Science and Technology (IJEST) 3, 8325-8333.
- 124.Fine I.Non-invasive method and system of optical measurements for determining the concentration of a substancein blood,” United state Patent USJun4,20026,400,972B1.
- 125.Kiani-Azarbayjany E, M K Diab, Jr J M Lepper.Active pulse blood constituent monitoring,”. United state Patent US,Apr29,2014 RE44875 E1 .
- 126.Talukdar G.May29,2012, “Non-Invasive Measurement of Glucose Content in Human Body:A Comparative Study,”. in Proceeding of 2nd International Conference on Biomedical Engineering for Assistive Technologies 1-6.
- 127.Xiang D, Iowa T U o. The University of Iowa (2006) Advances in Near-infrared Glucose Monitoring Using Pure Component Selectivity Analysis for Model Characterization and a Novel Digital Micromirror Array Spectrometer,” Phd thesis.
- 128.Amerov A K, Sun Y, M A Arnold, G W Small.Kromoscopic analysis in two- and three-component aqueous solutions of blood constituents. in Proceeding of SPIE, Optical Diagnostics and Sensing of Biological Fluids and Glucose and Cholesterol Monitoring,June13,2001,vol 4263 1-10.
- 129.L A Sodickson, M J Block. (1994) Kromoscopic analysis: a possible alternative to spectroscopic analysis for noninvasive measurement of analytes in vivo,”. , Clin Chem 40(19), 1838-44.
- 130.M J Block, H E Guthermann, Sodickson L.Rapid non-invasive optical analysis using broad bandpass spectral processing,” United state Patent Feb22,2000US6028311A.
- 131.A M Helwig, M A Arnold, G W Small. (2000) Evaluation of Kromoscopy: resolution of glucose and urea,”. , Appl Opt 39(25), 4715-20.
- 132.Zanon M, Sparacino G, Facchinetti A, Talary M, Mueller M et al. (2013) Non-Invasive Continuous Glucose Monitoring with Multi-Sensor Systems: A Monte Carlo-Based Methodology for Assessing Calibration Robustness,”. , Sensors 13(6), 7279-7295.
- 133.C F Amaral, Brischwein M, Wolf B. (2009) Multiparameter techniques for non-invasive measurement of blood glucose,”. , Sensors and Actuators B: Chemical 140(1), 12-16.
- 134.Caduff A, Mueller M, Megej A, Dewarrat F, R E Suri et al. (2011) Characteristics of a multisensor system for non invasive glucose monitoring with external validation and prospective evaluation,”. , Biosensors and Bioelectronics 26(9), 3794-3800.
- 135.Harman-Boehm I, Gal A, A M Raykhman, Naidis E, Mayzel Y. (2010) Noninvasive glucose monitoring: increasing accuracy by combination of multi-technology and multi-sensors,”. , Journal of diabetes science and technology 4(3), 583-595.
Cited by (38)
- 1.Sarhaddi Fatemeh, Azimi Iman, Labbaf Sina, Niela-Vilén Hannakaisa, Dutt Nikil, et al, 2021, Long-Term IoT-Based Maternal Monitoring: System Design and Evaluation, Sensors, 21(7), 2281, 10.3390/s21072281
- 2.Cicha Iwona, Priefer Ronny, Severino Patrícia, Souto Eliana B., Jain Sona, 2022, Biosensor-Integrated Drug Delivery Systems as New Materials for Biomedical Applications, Biomolecules, 12(9), 1198, 10.3390/biom12091198
- 5.Charles Rajesh Kumar J., Mary Arunsi B., Jenova R., Majid M.A., 2019, VLSI design of intelligent, Self-monitored and managed, Strip-free, Non-invasive device for Diabetes mellitus patients to improve Glycemic control using IoT, Procedia Computer Science, 163(), 117, 10.1016/j.procs.2019.12.093
- 6.Priyadarshini R Gayathri, Narayanan Sathiya, 2023, Analysis of blood glucose monitoring – a review on recent advancements and future prospects, Multimedia Tools and Applications, 83(20), 58375, 10.1007/s11042-023-17772-x
- 7.Moreno-Oyervides Aldo, Aguilera-Morillo M. Carmen, Larcher Fernando, Krozer Viktor, Acedo Pablo, 2020, Advanced Statistical Techniques for Noninvasive Hyperglycemic States Detection in Mice Using Millimeter-Wave Spectroscopy, IEEE Transactions on Terahertz Science and Technology, 10(3), 237, 10.1109/TTHZ.2020.2967236
- 9.Nakazawa Tomoya, Sekine Rui, Kitabayashi Masato, Hashimoto Yu, Ienaka Anna, et al, 2024, Non-invasive blood glucose estimation method based on the phase delay between oxy- and deoxyhemoglobin using visible and near-infrared spectroscopy, Journal of Biomedical Optics, 29(03), 10.1117/1.JBO.29.3.037001
- 10.Mansouri Sofiene, Boulares Souhaila, Alhadidi Tareq, 2020, Non‐invasive Measurement of Blood Glucose by Breath Analysis, IEEJ Transactions on Electrical and Electronic Engineering, 15(10), 1457, 10.1002/tee.23216
- 11.Susana Ernia, Ramli Kalamullah, Purnamasari Prima Dewi, Apriantoro Nursama Heru, 2023, Non-Invasive Classification of Blood Glucose Level Based on Photoplethysmography Using Time–Frequency Analysis, Information, 14(3), 145, 10.3390/info14030145
- 12.Alsunaidi Bushra, Althobaiti Murad, Tamal Mahbubunnabi, Albaker Waleed, Al-Naib Ibraheem, 2021, A Review of Non-Invasive Optical Systems for Continuous Blood Glucose Monitoring, Sensors, 21(20), 6820, 10.3390/s21206820
- 13.Zhou Xueling, Ling Bingo Wing‐Kuen, Tian Zikang, Ho Yiu‐Wai, Teo Kok‐Lay, 2020, Joint empirical mode decomposition, exponential function estimation and L 1 norm approach for estimating mean value of photoplethysmogram and blood glucose level , IET Signal Processing, 14(9), 652, 10.1049/iet-spr.2020.0096
- 14.Shokrekhodaei Maryamsadat, Quinones Stella, 2020, Review of Non-Invasive Glucose Sensing Techniques: Optical, Electrical and Breath Acetone, Sensors, 20(5), 1251, 10.3390/s20051251
- 15.Bteich Moussa, Hanna Jessica, Costantine Joseph, Kanj Rouwaida, Tawk Youssef, et al, 2021, A Non-Invasive Flexible Glucose Monitoring Sensor Using a Broadband Reject Filter, IEEE Journal of Electromagnetics, RF and Microwaves in Medicine and Biology, 5(2), 139, 10.1109/JERM.2020.3023053
- 17.Guin Santu, Chattopadhyay Madhurima, 2021, , , (), 101, 10.1007/978-981-33-6915-3_11
- 18.Kaysir Md Rejvi, Song Jiaqi, Rassel Shazzad, Aloraynan Abdulrahman, Ban Dayan, 2023, Progress and Perspectives of Mid-Infrared Photoacoustic Spectroscopy for Non-Invasive Glucose Detection, Biosensors, 13(7), 716, 10.3390/bios13070716
- 20.Diouf Alassane, Bouchikhi Benachir, El Bari Nezha, 2019, A nonenzymatic electrochemical glucose sensor based on molecularly imprinted polymer and its application in measuring saliva glucose, Materials Science and Engineering: C, 98(), 1196, 10.1016/j.msec.2019.01.001
- 21.Uluç Nasire, Glasl Sarah, Gasparin Francesca, Yuan Tao, He Hailong, et al, 2024, Non-invasive measurements of blood glucose levels by time-gating mid-infrared optoacoustic signals, Nature Metabolism, 6(4), 678, 10.1038/s42255-024-01016-9
- 22.Sim Joo Yong, Ahn Chang-Geun, Jeong Eun-Ju, Kim Bong Kyu, 2018, In vivo Microscopic Photoacoustic Spectroscopy for Non-Invasive Glucose Monitoring Invulnerable to Skin Secretion Products, Scientific Reports, 8(1), 10.1038/s41598-018-19340-y
- 23.Soltanizadeh Soroush, Naghibi Seyedeh Somayeh, 2024, Hybrid CNN-LSTM for Predicting Diabetes: A Review, Current Diabetes Reviews, 20(7), 10.2174/0115733998261151230925062430
- 25.Alhaddad Ahmad Yaser, Aly Hussein, Gad Hoda, Al-Ali Abdulaziz, Sadasivuni Kishor Kumar, et al, 2022, Sense and Learn: Recent Advances in Wearable Sensing and Machine Learning for Blood Glucose Monitoring and Trend-Detection, Frontiers in Bioengineering and Biotechnology, 10(), 10.3389/fbioe.2022.876672
- 26.Moreno-Oyervides Aldo, Martín-Mateos Pedro, Aguilera-Morillo M. Carmen, Ulisse Giacomo, Arriba María C., et al, 2019, Early, Non-Invasive Sensing of Sustained Hyperglycemia in Mice Using Millimeter-Wave Spectroscopy, Sensors, 19(15), 3347, 10.3390/s19153347
- 27.Hutter Tanya, Collings Thomas S., Kostova Gratsiela, Karet Frankl Fiona E., 2022, Point-of-care and self-testing for potassium: recent advances, Sensors & Diagnostics, 1(4), 614, 10.1039/D2SD00062H
- 28.Chakravarthula Kiran, Shah Tejas S., Pathak Divya, 2022, , , 283(), 85, 10.1007/978-981-16-9705-0_9
- 30.Ju Jian, Hsieh Chao-Mao, Tian Yao, Kang Jian, Chia Ruining, et al, 2020, Surface Enhanced Raman Spectroscopy Based Biosensor with a Microneedle Array for Minimally Invasive In Vivo Glucose Measurements, ACS Sensors, 5(6), 1777, 10.1021/acssensors.0c00444
- 32.Suresh R., Helenprabha K., 2022, IoMT aware data collective quadratic ensembled cat boost module classification algorithm for non-invasive blood glucose monitoring in VLSI design, Journal of Intelligent & Fuzzy Systems, 43(4), 4243, 10.3233/JIFS-220315
- 34.Siddiqui Sarah Ali, Zhang Yuan, Lloret Jaime, Song Houbing, Obradovic Zoran, 2018, Pain-Free Blood Glucose Monitoring Using Wearable Sensors: Recent Advancements and Future Prospects, IEEE Reviews in Biomedical Engineering, 11(), 21, 10.1109/RBME.2018.2822301
- 35.Gusev Marjan, Poposka Lidija, Spasevski Gjoko, Kostoska Magdalena, Koteska Bojana, et al, 2020, Noninvasive Glucose Measurement Using Machine Learning and Neural Network Methods and Correlation with Heart Rate Variability, Journal of Sensors, 2020(), 1, 10.1155/2020/9628281
- 36.Wang Zhuyu, Zhou Linhua, Liu Tianqing, Huan Kewei, Jia Xiaoning, 2022, Development of non-invasive blood glucose regression based on near-infrared spectroscopy combined with a deep-learning method, Journal of Physics D: Applied Physics, 55(21), 215401, 10.1088/1361-6463/ac4723
- 38.Al-Iraqi Entisar Younis, Fayadh Rashid Ali, 2021, Measurement of Non-Invasive Blood Glucose Level by UWB Transceiver in Diabetic Patient Type-1-, IOP Conference Series: Materials Science and Engineering, 1105(1), 012071, 10.1088/1757-899X/1105/1/012071