
Chalkley Counting in Oral Tongue Squamous Cell Carcinoma:Does It have A Prognostic Value?
Abstract
Chalkley counting has been regarded as a relatively reliable method of quantifying tumor angiogenesis. In this study we investigated the reliability of Chalkley counting in quantifying tumor angiogenesis in oral tongue squamous cell carcinoma (OTSCC) using CD34; and tumor vasculogenesis using angiotensin converting enzyme, angiotensin II receptor 1 and angiotensin II receptor 2, in 32 OTSCC samples. Chalkley counting was performed by two independent observers. The averages of three ‘hot spot’ counts were compared with known prognostic factors. All four markers showed no correlation with any of the prognostic factors. When comparing the results from the two independent observers, the only marker shown to have a significant moderate correlation was CD34. The other three markers showed no significant correlation. The lack of statistical significance between the independent observers, and known prognostic factors with the four markers used, shows that Chalkley counting is not a reliable prognostic tool in OTSCC.
Author Contributions
Academic Editor: Hammad Afzal, SZABIST, Karachi, Pakistan.
Checked for plagiarism: Yes
Review by: Single-blind
Copyright © 2019 Paul Campbell, et al.
 This is an open-access article distributed under the terms of the Creative Commons Attribution License, which permits unrestricted use, distribution, and reproduction in any medium, provided the original author and source are credited.
Competing interests
The authors declare that the research was conducted in the absence of any commercial or financial relationships that could be construed as a potential conflict of interest.
Citation:
Introduction
Oral cavity squamous cell carcinoma (OCSCC) is the 15th most common cancer worldwide 1 with vast geographical differences and greater incidence in developing countries 2, 3. OCSCC affects males most commonly, in their fifth and sixth decades of life, although the incidence is increasing in women and those under the age of 45 3. Risk factors for OCSCC include alcohol abuse, tobacco smoking and betel quid chewing 3.
The prognosis of OCSCC depends on tumor stage and other factors 2, 4, 5 including the extent of tumor angiogenesis - the development of new vessels from pre-existing blood vessels 6, 7. The observation that tumor growth and metastasis are dependent on tumor angiogenesis led to its quantitation to determine tumor-related prognosis, with studies confirming this association 8, 9.
Chalkley counting has been regarded as a relatively reliable method of quantifying tumor angiogenesis 9, 10, 11. This standardized method counts immunohistochemically stained endothelial cells within the tumor by using a 25-point Chalkley graticule and orientating it to overlap the highest number of stained microvessels 9, 10. Quantifying microvascular density by selecting areas with the most stained vessels - the neovascular ‘hotspots’, then counting distinct microvessels within a microscopic field of view 10. Others 9, 12 find quantifying angiogenesis in breast cancer by Chalkley counting of CD34+ endothelial cells as an independent prognostic factor. Waengertener et al. 11 also demonstrated an association between microvascular density quantified by Chalkley counting and the survival of patients with gastrointestinal stromal tumors. However, there remains no consensus on the accuracy and usefulness of Chalkley counting as a method of quantifying tumor angiogenesis, and hence prognosis.
Although Chalkley counting is a reasonably simple and commonly used histopathology procedure 13, its dependence on relatively subjective and observer-dependent selection of the microvascular ‘hotspots’ has led to its reliability in quantifying angiogenesis in breast cancer being questioned by the College of American Pathologists 14.
Physiologically, the renin-angiotensin system (RAS) regulates blood pressure and involves the conversion of angiotensinogen to angiotensin I (ATI) by renin. ATI is then converted by the angiotensin converting enzyme (ACE, also known as CD143), to angiotensin II (ATII) which acts on angiotensin II receptor I (ATIIR1) and angiotensin II receptor 2 (ATIIR2) 15. ACE is a marker for embryonic stem cell-derived hemangioblast differentiation 16. It regulates hemangioblast expansion and differentiation into either hematopoietic cells or endothelial cells via activation of ATIIR1 and ATIIR2, respectively.
Tumor vascular mimicry is a de novo blood vessel formation from cancer stem cells, rather than pre-existing endothelial cells 17. This leads to rapid blood perfusion underscoring rapid tumor growth and metastasis, a hallmark of an aggressive cancer. In this study we investigated the effectiveness of Chalkley counting in quantifying tumor angiogenesis in oral tongue squamous cell carcinoma (OTSCC) using CD34, and tumor vasculogenesis using ACE, ATIIR1 and ATIIR2, and correlating the counts to the known prognostic factors including tumor TNM stage, clinical stage, histological differentiation, and the presence of perineural and/or lymphovascular invasion.
Materials and Methods
Patients
Patients with OTSCC treated surgically at Hutt Hospital between April 1997 and September 2012 were included in this study which was approved by the Central Regional Health and Disability Ethics Committee (Ref. no,: 12/CEN/74).
50 patients were identified from our prospectively maintained head and neck database. Demographic data of the patients and details of their tumors were obtained from the database. Patients were excluded if they had previously undergone radiotherapy (n=2), had a recurrent tumor following previous treatment (n=1), the tumor sample was unavailable (n=6) or the slides were inadequate (n=9). 32 OTSCC samples were available for the final analysis.
Tumor TNM stage, clinical stage, histological differentiation, and presence of perineural and/or lymphovascular invasion of each OTSCC were documented.
Histochemical and Immunohistochemical Staining
Hematoxylin and eosin (H&E) staining was performed on 4μm-thick formalin-fixed paraffin-embedded sections of all 32 OTSCC samples to confirm the presence of the tumor in the sections and appropriate histological grading by an anatomical pathologist (HDB). 3,3-Diaminobenzidine (DAB) immunohistochemical (IHC) staining of the sections was then performed using the Leica Bond auto-stainer (Leica, Nussloch, Germany) as previously described 18. Staining for CD34 (ready-to-use, cat# PA0212, Leica), ACE (1:40; cat# MCA2054AbD, Serotec, Kidlington, UK), ATIIR1 (1:25; cat# Ab9391, Abcam, Cambridge, MA, USA), ATIIR2 (1:2000; cat# NBP1-77368, Novus Biologicus, Littleton, CO, USA), diluted with BondTM primary antibody diluent (cat# AR9352, Leica) was performed on all tissue samples.
Positive human control tissues used to confirm the specificity of the primary antibodies were liver for ACE and ATIIR1, and kidney for ATIIR2 (data not shown).
Quantitation of Tumor Angiogenesis and Tumor Vasculogenesis by Chalkley Counting
The tumor was marked on the slide by an anatomical pathologist (HDB) and tumor angiogenesis was quantified by two independent observers (P1 and P2) by counting the CD34+ endothelial cells on the microvessels within and immediately adjacent to the tumor. The extent of tumor vasculogenesis was similarly quantified by counting cells lining the microvessels that stained positively for either ACE, ATIIR1 or ATIIR2. Each slide was read by two observers at 400x magnification to subjectively select three ‘hotspot’ areas within each tumor that showed the greatest number of distinct positively stained microvessels. Each ‘hotspot’ was then assessed using a 25-point Chalkley graticule (Olympus, Tokyo, Japan), in a 200x field on a light microscope (10x eyepiece, 20x objective, area 0.196 mm2) (Olympus). The graticule was then orientated so that as many points as possible were on or within the positively stained microvessels. The average counts of both observers’ three ‘hotspots’ gave the total vascularity score used in the analyses.
Statistical Analysis
To determine statistical significance a Pearson’s correlation was performed using IBM SPSS v22.
Results
H&E staining (Figure 1A) confirmed the presence of SCC on the slides. To determine if Chalkley counting was a reliable method of quantifying tumor angiogenesis and tumor vasculogenesis, Chalkley counting on CD34 (Figure 1B, brown), ACE (Figure 1C, brown), ATIIR1 (Figure 1D, brown) and ATIIR2 (Figure 1E, brown) by two independent observers (P1 and P2) was performed. The averages of their three ‘hot spot’ counts were compared with known prognostic factors chosen for this study: tumor TNM stage, and clinical stage (Suppl. Table 1). Due to the relatively small sample numbers we were unable to perform any meaningful correlations between histological differentiation, the presence of perineural and/or lymphovascular invasion, and Chalkley counting of OTSCC.
Figure 1.A representative H&E stain of an oral tongue squamous cell carcinoma (OTSCC) showing the presence of the tumor (A). Representative images of OTSCC stained positively for CD34 (B, brown), ACE (C, brown), ATIIR1 (D, brown) and ATIIR2 (E, brown). Nuclei were counterstained with hematoxylin (blue). Orignial magnification 200X.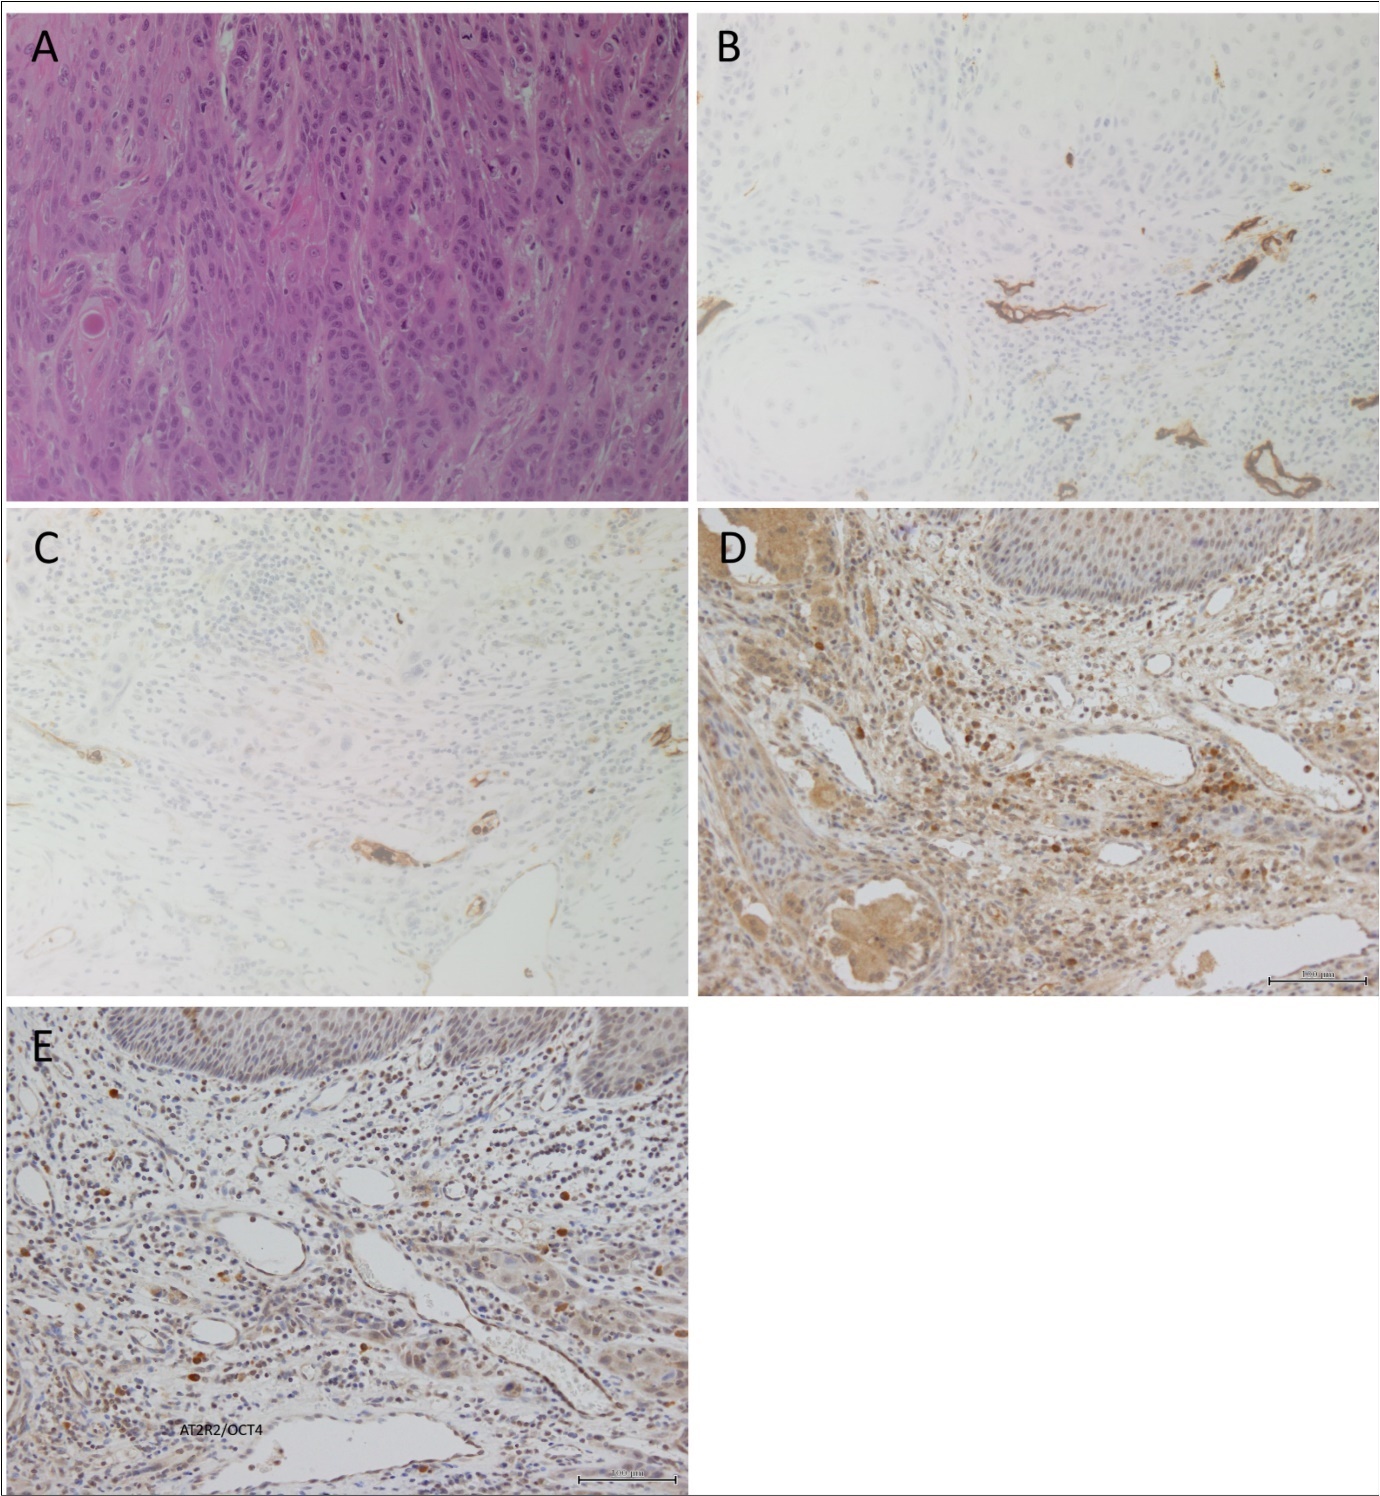
CD34 Chalkley Counting
When comparing the CD34 Chalkley counts between the two independent observers (P1 and P2), we could only detect a moderate correlation across the counts (Pearson’s r = 0.498, p < 0.001). Pearson’s correlation showed no significant correlations between the CD34 Chalkley counts and the prognostic factors of OTSCC chosen for this study (Table 1).
Table 1. Pearson's r Correlations for CD34 Chalkley Counts^| Prognostic Factors | Average CD34 Counts | ||||||
| T | N | M | Overall Clinical Stage | P1^ | P2^ | ||
| T | Pearson Correlation | 1 | .418** | .b | .442** | .059 | -.100 |
| Sig. (2-tailed) | .007 | .003 | .707 | .522 | |||
| N | 44 | 40 | 43 | 44 | 43 | 43 | |
| N | Pearson Correlation | .418** | 1 | .b | .209 | .096 | -.137 |
| Sig. (2-tailed) | .007 | .196 | .561 | .405 | |||
| N | 40 | 40 | 40 | 40 | 39 | 39 | |
| M | Pearson Correlation | .b | .b | .b | .b | .b | .b |
| Sig. (2-tailed) | |||||||
| N | 43 | 40 | 43 | 43 | 42 | 42 | |
| Overall Clinical Stage | Pearson Correlation | .442** | .209 | .b | 1 | -.039 | -.163 |
| Sig. (2-tailed) | .003 | .196 | .803 | .297 | |||
| N | 44 | 40 | 43 | 44 | 43 | 43 | |
| AverageCD34Counts(P1)^ | Pearson Correlation | .059 | .096 | .b | -.039 | 1 | .498** |
| Sig. (2-tailed) | .707 | .561 | .803 | .001 | |||
| N | 43 | 39 | 42 | 43 | 43 | 43 | |
| AverageCD34Counts(P2) ^ | Pearson Correlation | -.100 | -.137 | .b | -.163 | .498** | 1 |
| Sig. (2-tailed) | .522 | .405 | .297 | .001 | |||
| N | 43 | 39 | 42 | 43 | 43 | 43 | |
ACE Chalkley Counting
When comparing the ACE Chalkley counts from the two independent observers (P1 and P2), no significant correlation was detected (Pearson’s r = 0.222, p > 0.05). Pearson’s correlation showed no significant correlations between the ACE Chalkley counts and the prognostic factors of OTSCC chosen for this study (Table 2).
Table 2. Pearson's r Correlations for Average ACE Chalkley Counts^| Prognostic Factors | Average CD34 Counts | ||||||
| T | N | M | Overall Clinical Stage | P1^ | P2^ | ||
| T | Pearson Correlation | 1 | .418** | .b | .442** | .059 | -.100 |
| Sig. (2-tailed) | .007 | .003 | .707 | .522 | |||
| N | 44 | 40 | 43 | 44 | 43 | 43 | |
| N | Pearson Correlation | .418** | 1 | .b | .209 | .096 | -.137 |
| Sig. (2-tailed) | .007 | .196 | .561 | .405 | |||
| N | 40 | 40 | 40 | 40 | 39 | 39 | |
| M | Pearson Correlation | .b | .b | .b | .b | .b | .b |
| Sig. (2-tailed) | |||||||
| N | 43 | 40 | 43 | 43 | 42 | 42 | |
| Overall Clinical Stage | Pearson Correlation | .442** | .209 | .b | 1 | -.039 | -.163 |
| Sig. (2-tailed) | .003 | .196 | .803 | .297 | |||
| N | 44 | 40 | 43 | 44 | 43 | 43 | |
| AverageCD34Counts(P1) ^ | Pearson Correlation | .059 | .096 | .b | -.039 | 1 | .498** |
| Sig. (2-tailed) | .707 | .561 | .803 | .001 | |||
| N | 43 | 39 | 42 | 43 | 43 | 43 | |
| AverageCD34Counts(P2) ^ | Pearson Correlation | -.100 | -.137 | .b | -.163 | .498** | 1 |
| Sig. (2-tailed) | .522 | .405 | .297 | .001 | |||
| N | 43 | 39 | 42 | 43 | 43 | 43 | |
ATIIR1 Chalkley Counting
Comparison of ATIIR1 Chalkley counts from the two independent observers (P1 and P2) showed no significant correlation (Pearson’s r =0.160, p > 0.05). Pearson’s correlation showed no significant correlations between ATIIR1 Chalkley counts and the prognostic factors of OTSCC chosen for this study (Table 3).
Table 3. Pearson's r Correlations for Average ATIIR1 Chalkley Counts^| Prognostic Factors | Average ATIIR1 Counts | ||||||
| T | N | M | Overall ClinicalStage | P1^ | P2^ | ||
| T | Pearson Correlation | 1 | .418** | .b | .442** | -.158 | .211 |
| Sig. (2-tailed) | .007 | .003 | .329 | .196 | |||
| N | 44 | 40 | 43 | 44 | 40 | 39 | |
| N | Pearson Correlation | .418** | 1 | .b | .209 | .195 | -.068 |
| Sig. (2-tailed) | .007 | .196 | .255 | .696 | |||
| N | 40 | 40 | 40 | 40 | 36 | 35 | |
| M | Pearson Correlation | .b | .b | .b | .b | .b | .b |
| Sig. (2-tailed) | |||||||
| N | 43 | 40 | 43 | 43 | 39 | 38 | |
| Overall Clinical Stage | Pearson Correlation | .442** | .209 | .b | 1 | -.244 | .153 |
| Sig. (2-tailed) | .003 | .196 | .129 | .354 | |||
| N | 44 | 40 | 43 | 44 | 40 | 39 | |
| Average ATIIR1 Counts(P1) ^ | Pearson Correlation | -.158 | .195 | .b | -.244 | 1 | .160 |
| Sig. (2-tailed) | .329 | .255 | .129 | .311 | |||
| N | 40 | 36 | 39 | 40 | 43 | 42 | |
| Average ATIIR1 Counts(P2) ^ | Pearson Correlation | .211 | -.068 | .b | .153 | .160 | 1 |
| Sig. (2-tailed) | .196 | .696 | .354 | .311 | |||
| N | 39 | 35 | 38 | 39 | 42 | 42 | |
ATIIR2 Chalkley Counting
Comparison of the ATIIR2 Chalkley counts from the two independent observers (P1 and P2) showed no significant correlation (Pearson’s r =0.184, p > 0.05). Pearson’s correlation showed no significant correlations between the ATIIR2 Chalkley counts with the prognostic factors of OTSCC chosen for this study (Table 4).
Table 4. Pearson's r Correlations for Average ATIIR2 Chalkley Counts^| Prognostic Factors | Average ATIIR1 Counts | ||||||
| T | N | M | Overall Clinical Stage | P1^ | P2^ | ||
| T | Pearson Correlation | 1 | .418** | .b | .442** | -.158 | .211 |
| Sig. (2-tailed) | .007 | .003 | .329 | .196 | |||
| N | 44 | 40 | 43 | 44 | 40 | 39 | |
| N | Pearson Correlation | .418** | 1 | .b | .209 | .195 | -.068 |
| Sig. (2-tailed) | .007 | .196 | .255 | .696 | |||
| N | 40 | 40 | 40 | 40 | 36 | 35 | |
| M | Pearson Correlation | .b | .b | .b | .b | .b | .b |
| Sig. (2-tailed) | |||||||
| N | 43 | 40 | 43 | 43 | 39 | 38 | |
| OverallClinicalStage | Pearson Correlation | .442** | .209 | .b | 1 | -.244 | .153 |
| Sig. (2-tailed) | .003 | .196 | .129 | .354 | |||
| N | 44 | 40 | 43 | 44 | 40 | 39 | |
| AverageATIIR1Counts(P1) ^ | Pearson Correlation | -.158 | .195 | .b | -.244 | 1 | .160 |
| Sig. (2-tailed) | .329 | .255 | .129 | .311 | |||
| N | 40 | 36 | 39 | 40 | 43 | 42 | |
| AverageATIIR1Counts(P2) ^ | Pearson Correlation | .211 | -.068 | .b | .153 | .160 | 1 |
| Sig. (2-tailed) | .196 | .696 | .354 | .311 | |||
| N | 39 | 35 | 38 | 39 | 42 | 42 | |
Discussion
Chalkley counting as a method of quantifying tumor angiogenesis and tumor vasculogenesis to prognosticate cancer has been widely used across different cancer types, including breast 9, 13, 19 and gastrointestinal 11 cancers. Hansen et al. 13 investigated different methods of quantifying tumor angiogenesis in breast cancer and reported that Chalkley counting produces the least observer variability. They used this method to study 836 breast cancer patients and concluded that Chalkley count is a reliable and independent prognostic tool for breast cancer 9. Despite this earlier study indicating Chalkley count having the least observer variability in selecting the microvascular ‘hotspot’ (the most observer-dependent step), the College of American Pathologists regards quantifying microvessel density by Chalkley counting as being an unreliable prognostic tool for breast cancer 14.
Vascular mimicry leads to greater perfusion in cancer leading to tumor growth and metastasis 17. We had therefore chosen ACE in this study on OTSCC to quantify tumor vasculogenesis. ATIIR1 and ATIIR2 were also selected given their involvement in putative stem cell differentiation 16.
The observer-dependent selection step in Chalkley counting is highlighted in this study with only a moderate correlation observed for CD34, and no correlations between the two independent observers for ACE, ATIIR1 and ATIIR2. Furthermore, there was no significant correlation between each of the four markers and the prognostic factors of OTSCC chosen in this study. These results are consistent with the findings of Hannen and Riediger 20, showing the unreliability of similar methods for quantifying angiogenesis/vasculogenesis in predicting OCSCC. This may in part be due to the relatively small sample size used in this study and it remains the topic for further investigation.
Possible reasons for Chalkley counting being reliable for some (e.g., breast, gastrointestinal and prostate) cancers, but not for OTSCC, include tumor angiogenesis not being a suitable measure for determining prognosis in oral tissues which are typically vessel-rich 20. In addition, Chalkley counting shows great variation between observers and lacks reproducibility as a result of other factors such as differences in the size and number the observer-dependent ‘hot spots’ during the selection step 19, 20. Furthermore, the appropriateness of using ACE, ATIIR1 and ATIIR2 as markers for tumor vasculogenesis, at least in OTSCC, remains to be conclusively determined. These factors contribute to a decrease in the overall reliability and validity of this method and bring in to question its role in the prognostic setting.
We applied Chalkley counting to quantify tumor angiogenesis using CD34 and tumor vasculogenesis using ACE, ATIIR1 and ATIIR2 but found this to be unreliable in OTSCC. Its weakness relates to the reproducibility (also known as reliability) of its results. Reliability is a criterion that is applied universally to measuring instruments and is generally obtained by correlating the results of repeated measurements on the same things by both the same and different people (co-efficients of equivalence) and/or at similar and different times (coefficients of stability). When both times and observers are different it yields the coefficient of stability and equivalence. As well as being important for obvious reasons, reliability is critical for its relationship to validity (the degree to which the measurement actually reflects the characteristics of what it is measuring). In almost all cases reliability indicates the maximum possible level of validity that can be obtained. Acceptable levels of reliability begin to be reached when its correlations are 0.7 or more – meaning more than about 50% of the variance is accounted for. Depending on the task, however, levels of reliability may need correlations in the range of 0.9 (meaning 80%+ of the variance is required to be accounted for). Averaging observations from a number of observers or a number of repeats will increase the reliability estimates to levels which can be predicted from the application of the Spearman-Brown Formula. In our observations we recorded correlations no greater than 0.5. These results indicate that Chalkley counting is not suitable for our measurements procedures.
The lack of statistical significance between the independent observers, and the known prognostic factors we have chosen with the markers presented in this study, leads us to conclude that Chalkley counting is not a suitable method for quantifying tumor angiogenesis and vasculogenesis in OTSCC, and therefore, an unreliable prognostic tool.
The limitations of this study include the relatively small cohort. Future work requires a larger sample size and the use of other marker of angiogenesis, such VEGFR2, however, this remains the topic of further investigation.
Contribution of Authors
TI and STT formulated the study hypothesis.
TI, HB and STT designed the study.
PC, RB, LJL, HDB and TI interpreted the IHC data.
PC, RB, LJL performed the Chalkley counting
RM performed the statistical analysis
PC, RB, TI, RM and STT drafted the manuscript.
All authors commented on and approved the manuscript.
Ethics Approval
This study was approved by the Central Regional Health and Disability Ethics Committee (ref. no: 12/CEN/74).
Average Chalkley Counting^ of CD34, ACE, ATIIR1 and ATIIR2 in 32 OTSCC Samples Analysed against Chosen Prognostic Factors
Acknowledgements
We thank Ms Liz Jones of the Gillies McIndoe Research Institute for their assistance in IHC staining. PC and RB were supported by summer scholarships from the Deane Endowment Trust.
References
- 1.Globocan. (2012) Estimated cancer incidence, mortality and prevalence worldwide in 2012. International Agency for Research on Cancer, World Health Organisation. https://www.iarc.fr/ news-events/latest-world-cancer-statistics-globocan-2012-estimated-cancer-incidence-mortality-and-prevalence-worldwide-in-2012/
- 2.Massano J, Regateiro F S, Januário G, Ferreira A. (2006) Oral squamous cell carcinoma: Review of prognostic and predictive factors. Oral Surg Oral Med Oral Pathol Oral Radiol Endodontics. 102, 67-76.
- 3.Maund I, Jefferies S. (2015) Squamous cell carcinoma of the oral cavity, oropharynx and upper oesophagus. , Medicine 43, 197-201.
- 4.O-charoenrat P, Pillai G, Patel S, Fisher C, Archer D et al. (2003) Tumour thickness predicts cervical nodal metastases and survival in early oral tongue cancer. , Oral Oncol 39, 386-390.
- 5.Ribeiro K, Kowalski L, Latorre M. (2003) Perioperative complications, comorbidities, and survival in oral or oropharyngeal cancer. , Arch Otolaryngol–Head Neck Surg 129, 219-228.
- 7.Imamura M, Yamamoto H, Nakamura N, Oda Y, Yao T et al. (2007) Prognostic significance of angiogenesis in gastrointestinal stromal tumor. , Mod Pathol 20, 529-537.
- 8.Bosari S, AKC Lee, DeLellis R A, Wiley B D, Heatley G J et al. (1992) Microvessel quantitation and prognosis in invasive breast carcinoma. , Human Path 23, 755-761.
- 9.Hansen S, Grabau D A, Sørensen F B, Bak M, Vach W et al. (2000) The prognostic value of angiogenesis by chalkley counting in a confirmatory study design on 836 breast cancer patients. , Clin Cancer Res 6, 139-146.
- 10.Vermeulen P B, Gasparini G, Fox S B, Colpaert C, Marson L P et al. (2002) Second international consensus on the methodology and criteria of evaluation of angiogenesis quantification in solid human tumours. , Eur J Cancer 38, 1564-1579.
- 11.Waengertnera L, Meurera L, Cerskia M. (2011) Microvessel density (chalkley method) in a series of 79 gastrointestinal stromal tumors. , Gastroenterol Research 4, 252-256.
- 12.Weidner N, Folkman J, Pozza F, Bevilacqua P, Allred E N et al. (1992) Tumor angiogenesis: A new significant and independent prognostic indicator in early-stage breast carcinoma. , J Nat Cancer Inst 84, 1875-1887.
- 13.Hansen S, Grabau D A, Rose C, Bak M, Sørensen F B. (1998) Angiogenesis in breast cancer: A comparative study of the observer variability of methods for determining microvessel density. , Lab Invest 78, 1563-1573.
- 14.Fitzgibbons P L, Page D L, Weaver D, Thor A D, Allred D C et al. (2000) Prognostic factors in breast cancer. College of American Pathologists Consensus Statement. , Arch Pathol Lab Med 124, 966-978.
- 15.Stroth U, Unger T. (1999) The renin-angiotensin system and its receptors. , J Cardiovasc Pharmacol 33, 21-28.
- 16.Zambidis E T, Soon Park T, Yu W, Tam A, Levine M et al. (2008) Expression of angiotensin-converting enzyme (CD143) identifies and regulates primitive hemangioblasts derived from human pluripotent stem cells. , Blood 112, 3601-3614.
- 17.REB Seftor, Hess A R, Seftor E A, Kirschmann D A, Hardy K M et al. (2012) Tumor cell vasculogenic mimicry. , Am J Pathol 181, 1115-1125.
- 18.EMS Tan, Chudakova D A, Davis P F, Brasch H D, Itinteang T et al. (2015) Characterisation of subpopulations of myeloid cells in infantile haemangioma. , J Clin Pathol 68, 571-574.