
Abstract
Nanocomposites are worn resistant materials used in cutting tool applications. The materials are composed of ultrafine powder hard phase grains surrounded by a tough binder phase carbon nanotubes (Mo2C)1-x–(TiC)x (2≤x≤4)//1Wt% SWCNTs. Composite bicarbide Mo2C-TiC was rapidly synthesised and simultaneously consolidated by field activated sintering technique (spark plasma sintering) at which the extensive volume expansion occurred as a function of the volumic fraction from 20 to 40 vol.% of TiC powders and 1 Wt.% of SWCNTs was reinforcement of the NCMC’s. The sintered powder mixture was examined by XRD patterns, the morphology of the obtained phase was observed by SEM and the phase compositions in different regions were analyzed by EDX. The composites were processed using Field Activated Sintering Technique, spark plasma sintering (SPS) at temperatures in the range of 1700-1800°C with addicting of SWCNTs. The effects of SWCNTs addition on phases morphology, microstructure hardness and fracture toughness of the nanocomposite were investigated. The best product contained 1.0 Wt% SWCNTs from (Mo2C)1-x–(TiC)x , x= 0.2 which was sintered at 1700°C, 70 MPa for 10 min, M0.8T0.2/ 1 Wt% SWCNTs exhibit a better density, highest hardness and good ductility. Relative densification was achieved 99.5 % from the theoretical and good mechanical properties like hardness and fracture toughness (KIC=5.6 Mpa m1/2) are improved. The results were confirmed using Raman scattering resonant spectroscopy.
Author Contributions
Academic Editor: Fazal Raziq, School of Physics, University of Electronic Science and Technology of China.
Checked for plagiarism: Yes
Review by: Single-blind
Copyright © 2020 Badis Bendjemil, et al.
 This is an open-access article distributed under the terms of the Creative Commons Attribution License, which permits unrestricted use, distribution, and reproduction in any medium, provided the original author and source are credited.
Competing interests
The authors have declared that no competing interests exist.
Citation:
Introduction
Nanomaterials (defined as being in the size range 1-100 nm in at least one dimension) have been the subject of extensive research in recent years due to their extraordinary properties over their conventional counterparts. For more than two decades, the topic of nanomaterials’ development has been widely investigated by many researchers aiming at exploring their potential and finding suitable applications. Ultimately, they proved to be beneficial in several applications in areas like surface engineering, drug delivery, analytical chemistry, bio encapsulation, Nano composite as well as in electronic, magnetic, optical, and mechanical devices 1, 2, 3, 4, 5, 6, 7, 8, 9, 10, 11, 12, 13, 14.
These applications do stimulate a great deal of research interest amongst institutions and companies aiming at capitalizing on their potential. However, there are still a number of difficulties when it comes to processing of these nanomaterials especially in fabricating final products as these nanomaterials may lose their crystallite size along the path of processing. These problems have to be tackled before the potential of nanoparticles or nanomaterials can be fully realized 15. The problem of undesirable grain growth is persistent in the sintering/consolidation processes of several advanced materials that usually gain their importance and thus potential properties from their reduced crystallite sizes.
The composite (Mo2C-TiC) based hard metals or cemented carbides represent an important class of materials used in a wide range of industrial applications which primarily include cutting/drilling tools and wear resistant components. The introduction and processing of nanostructured composite made of Mo2C-TiC based carbon nanotubes and their subsequent consolidation to produce dense components have been the subject of several investigations. One of the attractive means of producing this class of materials is by mechanical alloying technique. However, one of the challenging issues in obtaining the right end-product is the possible loss of the nanocrystallite sizes due to the undesirable grain growth during powder sintering step. The present paper highlights some key issues related to powder synthesis and sintering of composite Mo2C-TiC -based nanostructured materials using mechanical alloying. The path of directly consolidating the powders using nonconventional consolidation techniques will be addressed and some light will be shed on the advantageous use of such techniques. Carbon nanotubes-bonded hard nanomaterials will be principally covered in this work along with an additional exposure of the use of other binders in the Mo2C-TiC-based hard nanomaterials.
In order to summarize some of the relevant information reported so far, the various RS process used for successful synthesis of this hard nanocomposites are historically listed in Table 1 along with the corresponding reported applied current characteristics and the apparatus adopted. It can be clearly seen that, as already mentioned, diverse current wave forms and/or apparatus are adopted for the same process. In the last column of Table 1 the references indicate where, at our best knowledge, the process name/acronym, and for each process name/acronym, the different applied current wave forms or adopted apparatus were reported for the first time. It should be noted that the names ECAS 30, and field activated sintering technique (FAST) 31 were introduced to designate the consolidation methods based on the application of a electric field/current regardless their waveforms, while pulse electric current sintering (PECS) was used by some authors as a generalization of RS methods which involve the application of a pulsed electric current 32. It should be pointed out once more that the applied characteristics and/or the apparatus adopted were in some cases not specified. Therefore, Table 1 should not be considered as comprehensive of all possible combinations of process name, applied current and apparatus adopted in this research field. 5, 6, 7, 8, 9, 10, 11, 12, 13, 14, 15, 16, 17, 18, 19, 20, 21, 22, 23, 24, 25, 26, 27, 28, 29, 30, 31, 32, 33, 34, 35, 36, 37, 38.
Table 1. Overview of RS process
In this work the studies of (Mo2C)1_x–(TiC)x (2≤x≤4)// 1 Wt% SWCNTs based NCMC ‘s, sintered at low pressures (70 MPa—provided by field activated sintering technique (SPS) are presented. A fine (Mo2C)1_x–(TiC)x (2≤x≤4)// powder grade was chosen as the matrix material The use of only 20 vol.% of TiC with 1 Wt% SWCNTs reinforcements aims to increase physical and mechanical resistance of the(NCMC’s). Moreover, the relatively small content of dispersed phase decreases the probability of direct contacts between their particles. The (NCMC’s) sintering temperature is higher than 1700 °C. In the case of low temperature SPS sintering process weak bonding between the TiC grains may yield to low micro hardness and high fracture toughness.
Experimental
Commercially available powders of TiC (<2 µm, 99.8 % purity, Sumitomo Sitix, Co. Ltd., Japan, Mo2C (<2 µm, 99.8 % purity, Nihon New Metals Co. Ltd., Japan) and SWCNTs with diameter of 1.2 nm (I have synthesized by Laser ablation at IFW-TU-Dresden-Germany in 2002) were used as the raw materials were used as starting materials. The mixture containing (Mo2C)1_x–(TiC)x (2≤x≤4) and with additionof 1 Wt% SWCNTs, (NCMC’s) were prepared by wet milling in anhydrous alcohol for 3 h..
To obtain homogenized and fine powder mixtures, the powder mixtures of Mo2C–TiC were ball-milled at a high speed of 200 RPM for 12 h by using WC balls (diameter: 3 mm) and ethanol as the milling media.
Preliminary treatment of SWCNTs was carried out to minimize the agglomerate of the added SWCNTs. Firstly; the weighed SWCNTs were immersed into acetone for about 20 h, and then were ultrasonically dispersed for 3 h.
Secondly, the treated SWCNTs (3 vol.%) were mixed with the former ball-milled blend (Mo2C–TiC) by magnetic agitation for 8 h. Again, a ball milling was applied to the slurry (Mo2C–TiC/1 Wt% SWCNTs) at a speed of 200 RPM for 10 h for further mixing.
Finally, the powder mixtures with dispersed SWCNTs were dried by rotary evaporator under vacuum condition and were sieved to 60 meshes.
Based on previous sintering tests, the composition ratio of the composites was designed as follows (vol.%):
(Mo2C)1_x–(TiC)x (2≤x≤4)/ 1 Wt% SWCNTs (here after, it is referred as MTC).
The (NCMC’s) were sintered by SPS methods (Figure 1). The tree sintering schedules are shown. In the spark plasma sintering process, temperature profile and punish displacement or shrinkage the displacement velocity is not presented here (Figure 1b).
Figure 1.SINTER-LAB, FCT–HP D 25, SPS-1050, ENSICAEN. (a)-The author, (b)-Variation of the displacement, the displacement rate and the temperature in dependence of the heating time, (c, d)- The plasma produced by the current in the SPS chamber.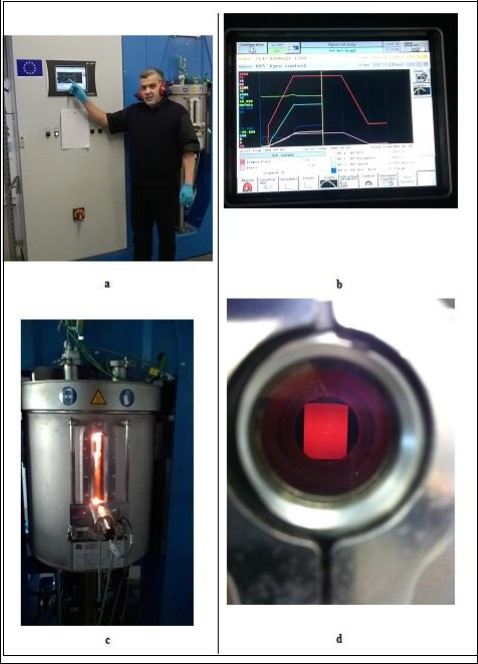
The resulting MTC ultrafine powder mixtures were hot-pressed in graphite dies (inner diameter: 20 mm) coated with graphite lubricant at (1700–1800 °C) in vacuum.
The applied pressure of 70 MPa was adjusted to the powder at room temperature and kept constant throughout the hot pressing process. The pressure was applied at the beginning of the sintering process because high green density is favorable for better densification rate by reducing the pores prior to the densification during heating. The heating rate was about 10 °C/min and the dwelling time at terminal temperature was 60 min. The temperature was measured by an infrared pyrometer through a hole opened in the graphite die. Furthermore, for monitoring densification process, the shrinkage of the powder compact was measured by a displacement sensor during the hot pressing.
The dimensions of the finally hot pressed samples were about 20 mm in diameter and 3 mm in thickness.
The mixtures were loosely compacted into a graphite die of 20 mm in diameter after calculation of the weight according to the theoretical density of the compounds and sintered in the vacuum (1 Pa) at various temperatures (1700–1800 °C) using an SPS apparatus (Lab. SINTER, SPS-1050, Sumitomo Coal Mining Co. Ltd. GERMANY) (Table 2). A constant heating rate of 100°C/min was employed, while the applied pressure was 70 MPa. The on/off time ratio of the pulsed current was set to 12/2 in each run. The maximum current reached approximately 3000 A during sintering.
Table 2. SPS synthesis parameters| Sintered Samples | T(C) | Time of the cycle (min) | Heating rate (C/min) | P(MPa) | Ar ( sccm ) | SWCNTs d=1nm | Current (A) | Diameter of Die (mm) |
| TiC | 1700 | 10 | 100 | 70 | 200 | 00 | 3000 | 20 |
| M0.6T0.4 | 1700 | 10 | 100 | 70 | 200 | 00 | 3000 | 20 |
| M0.8T0.2/1Wt% SWCNTs | 1700 | 10 | 100 | 70 | 200 | 1.0 | 3000 | 20 |
The soaking time at high temperatures was within 10 min. The upper ram of the SPS apparatus was fixed, while the displacement of the shifting lower press ram was recorded in order to analyze the synthesis and sintering. The sintered samples are presented in the Figure 2.
Figure 2.Images of sintered MTC: (a, b) coarse grinding; (c) fine polishing.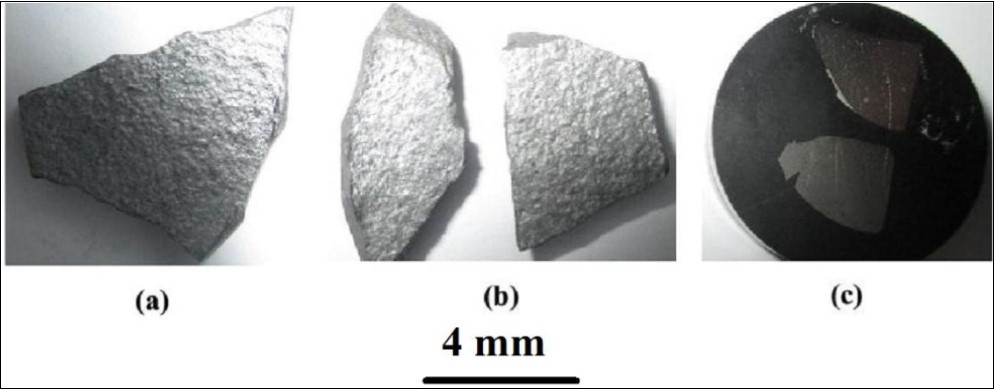
Density of the sintered samples was measured by the Archimede’s using the densimeter type Micromiritics Accupyc 1330. The microhardness at the top was measured by a diamond Vickers hardness tester (MVK-H1, Meter-Mitutoyo, Japan).
The indentation loads, ranging from 10 to 500 N, were applied for 15 s for each measurement. The fracture toughness was measured using the Vickers indentation by the measurement of the producing failler.
In this study, 04 samples for each sintering process were fabricated to obtain an average relative density and hardness.
Young’s modulus of the composites was determined by ultrasonic wave transition method measuring the velocity of ultrasonic sound waves passing through the material using an ultrasonic flaw detector (Panametrics Epoch III). The hardness and the fracture toughness were determined by the Vickers indentation method applying load of 294 N (HV30) and 490 N (HV50), by a Future Tech FLC-50VX hardness tester. For each sample 4 indentations were made and the stress intensity factor KIC was calculated from the length of Palmqvist cracks which developed during a Vickers indentation test using E. Rocha-Rangel’s equation 53. The wear resistance and the friction coefficient will be performed in the near future. The hardness (H), the elastic modulus (E) and the fracture toughness (KIC) of the fabricated samples were measured under ambient conditions using the instrumented Vickers indentation method (Zwick Roell, ZHU 2.5 apparatus).
The impression diagonal (2a) was measured, and the hardness values were calculated according to the following relation:
Hv = (1.8544*F)/(2a)2 …...(1)
the fracture toughness was also calculated by indentation fracture (IF) method according to the equation:
KIC = (0.16Hva1/2)(c/a)-3/2…...(2)
Where Hv was the Vickers hardness, a was the half-length of the indentation diagonal and c was the half-length of the median crack generated by indentation. Generally, the fracture toughness measured by IF method were fluctuating values with relatively large deviations due to the phase distribution and measurements errors of calculation. Thus a linear regression model was applied to get a reliable value of indentation fracture toughness. To obtain the values of A, B and R2, a series of indentation loads (10 N, 50 N, 100 N, 300, 500 N) were applied to get the relations of P and c3/2.
Results and Discussion
XRD Analysis of Sintered M1-XTx (2≤x≤4) /1Wt% SWCNTs, (NCMC’s)
XRD analysis of the samples indicates that the only phases formed in the sample without SWCNTs are titanium carbide TiC, with a cubic crystal structure and Mo2C with orthorhombic crystal structure. The addition of 1Wt%SWCNTs reinfort has considerable effect on XRD pattern. XRD spectrum of the (NCMC’s), which indicates that the reaction between the TiC powders and SWCNTs did happen during the sintering process. It is considered that disordered carbons on wall defects and the open ends of the SWCNTs serve as carbon sources for interfacial reaction. The sintered samples consisted mainly Mo2C-TiC of matrix, as major phases, and some secondary phases, such as SWCNTs appeared depending on the sintering temperature. X-ray diffraction patterns of sample M1-xTx(2≤x≤4) /1Wt% SWCNTs,M0.8T0.2/1Wt% SWCNTs, (NCMC’s) sintered at 70 MPa pressure were enhanced because they are reinforced with the SWCNTs phases, TiC and SWCNTs with higher intensity, the SWCNTs content at the sintering temperature of 1700 °C for 10 min at 70 MPa, which was reduced to 10 % when sintered at pressure because it reacted with TiC to produce TiC-SWCNTs, in the TiC grain new intergranular reinforcement slightly increases.
These results suggest that TiC grains grew preferentially with the basal planes rotating towards the loading direction of SWCNTs.
The quantification analysis will be used to calculate the phase of TiC from XRD using Rietveld affinement 56.
SEM Microstructural Observation of Sintered M1-XTx(2≤x≤4) /1Wt% SWCNTs, (NCMC’s)
The SEM microstructures of samples with following compositions:
M1-xTx (2≤x≤4) /1wt% SWCNTs, M0.8T0.2/1Wt% SWCNTs, with x=0.2
T (TiC), M1-xTx (2≤x≤4) /1Wt% SWCNTs, M0.6T0.4, with x=0.4
The SEM microstructures (Figure 3) revealed that the nanocomposite has good density of the binderless phases in the final structure of the products. The high magnification representative microstructure of the sample without SWCNTs consists of large Mo2C (dark) grains and TiC (gray) particle sintered together (Figure 3c-d-e-f-h). The addition of 1 Wt % SWCNTs (Figure 3e-f) to the reaction changed the morphology of TiC from slightly finer grains with near spherical morphology to the large plate like grains. Figure 3e-d, showed the SWCNTs into TiC particle grain and no in the grain boundaries forming the interface with different orientations. The mechanical properties are induced by both phases and grain boundaries. This is a contribution to the increasing of the microhardness. These steps are characteristics of crystal growth with interface-controlled growth mechanism 55. In the Figure 3g is presented the typical of the loss of SWCNTs identified by the pore like structure (holes) in addition to unreacted SWCNTs.
Figure 3.High magnification microstructural representative SEM image of MTC polished and etched surface for the sintered samples using a 20-mm diameter die. (a)-TEM of SWCNTs, (b)-SinteredTiC grains , (c)-Nanocompositesoverview, (d)- nanocomposites overview with magnification, (e)-SWCNTs into the TiC grain, (f)-SWCNTs into the TiC grains ,(g)-Pore like structure of losses SWCNTs , (h)-Nanocomposites overview with higher magnification.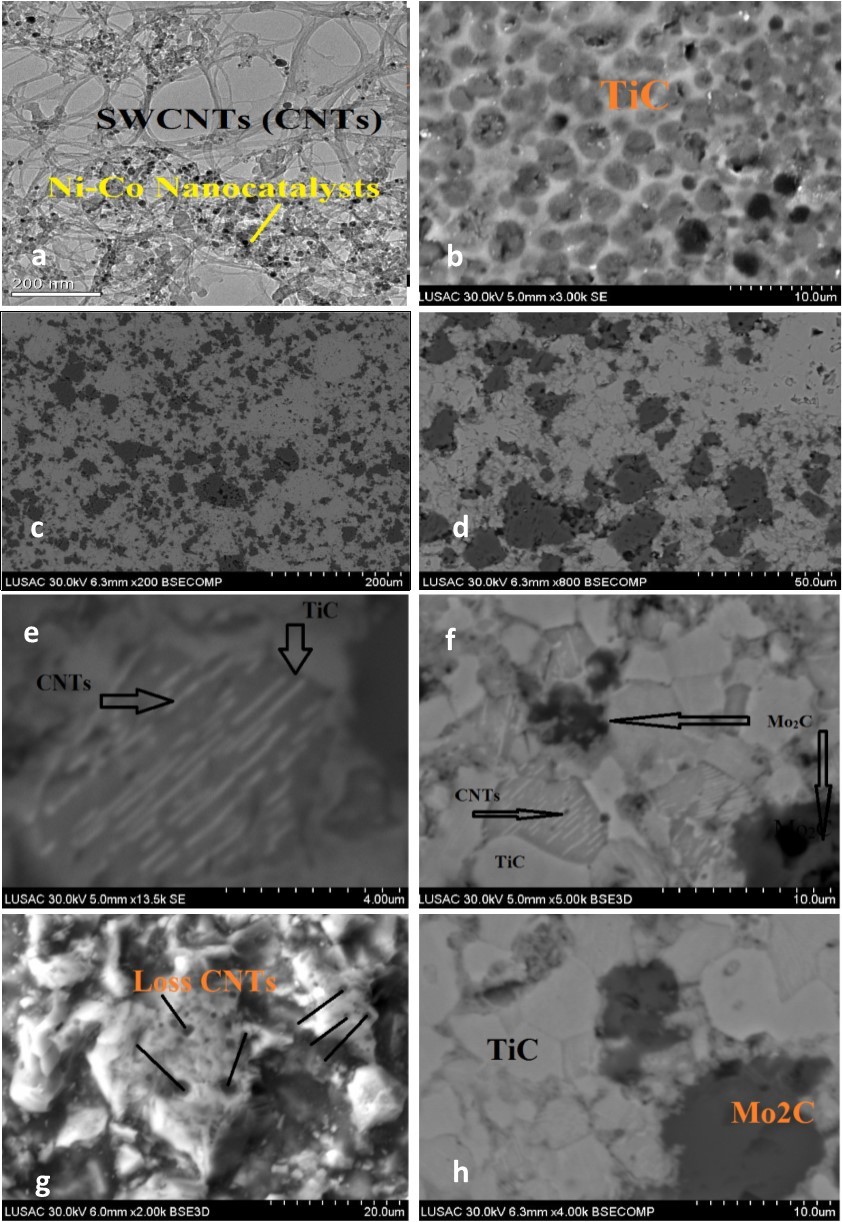
High magnification images of the starting ultrafine powder of SWCNTs and sintered titanium carbide (TiC) are presented in Figure 3 a-b.
In the Figure 4, the microstructural representation and EDS analysis displays elemental analyses of the various regions of the sintered samples. Secondary electron image, atomic concentration cartographies of Mo, Ti, and C.
Figure 4.Microstructural representation and EDS maps of MTC analysis displays elemental analyses of the various regions of the sintered samples. Secondary electron image, atomic concentration cartographies of Mo, Ti, and C of MTC polished and etched surface for the sintered samples using a 20-mm diameter die. (a)- Overview of the nanocomposite, (b)- Cartographies of Ti, (c)- Cartographiesof C, (d)- Cartographies of Mo
EDS spectra and was used to determine the elemental composition of the different regions in the sample and are presented at the Figure 5.
Figure 5.EDX spectra in different regions of MTC polished and etched surface for the sintered samples using a 20-mm diameter die: (Spot1)- TiC regions, (Spot2)-Mo2C regions, (Spot3)-SWCNTs regions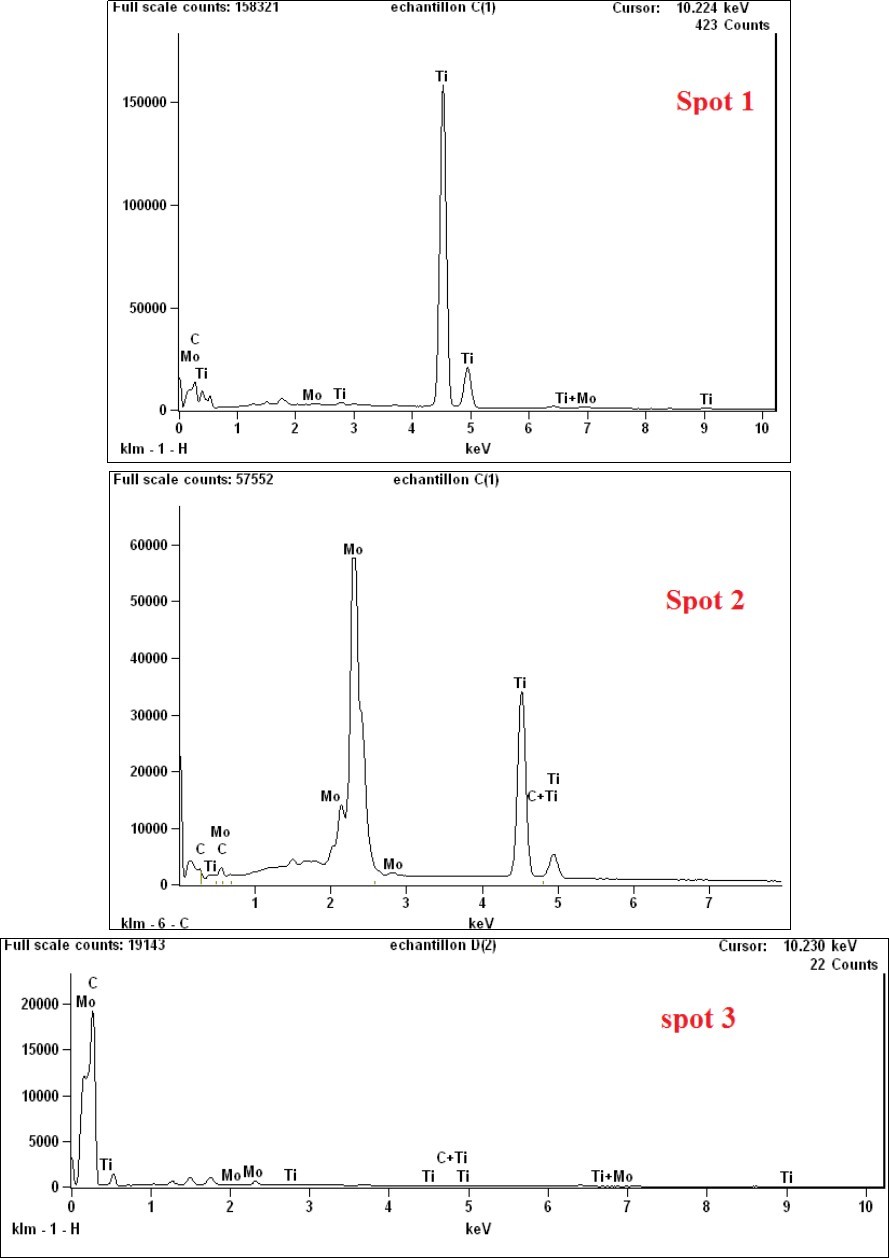
Relative Density of the Sintered M1-XTx(2≤x≤4) /1Wt% SWCNTs, (NCMC’s)
The variation of the relatives density of sintered M1-xTx(2≤x≤4) /1Wt% SWCNTs, (NCMC’s) with SWCNTsr einforcement is shown in Table 3. The theoretical density of the composite used for obtaining relative density was calculated using a rule of mixture, using the densities of two constituent phase (ρ Mo2C= 4.53 g /cm2, ρ TiiC = 4.50 g /cm2, ρSWCNTs = 2.25 g/cm2) with the given SPS processing parameters, the M1-xTx///1Wt% SWCNTs with x=2, sample exhibited best densification with relative density greater than 99.5%, with the similar processing parameters with variation of TiC/SWCNTs content. The relative density increased with increasing of the reinforcement of 1.0 wt% SWCNTs. The M0.8T0.2/1Wt% SWCNTs, (NCMC’s) at T=1700°C exhibited relative density of about 99.5%.
Table 3. Basic physical–mechanical properties of the samples obtained by SPS sintering| Sintered samples | TiC | M 0.6 T 0.4 | M 0.8 T 0.2 /1Wt% SWCNTs, |
| Density (relative density) g/cm3 (%) | 92.04 | 95.06 | 99.5 |
| Young’s modulus (relative Young’s) GPa (%) | 439.4 | 490.6 | 520.8 |
Depending on the final density to be achieved, the SPS operating condition were properly chosen, that is, 1700 °C, 70 Mpa for 10 min, to obtain a highest relative density for the (NCMC’s), M0.8T0.2/1Wt% SWCNTs, dense M0.6T0.4, TiC for zero compacts porosity, 99.5, 95.06, and 92.04, respectively.
The 0.5 % porosity of the sample M0.8T0.2/1Wt% SWCNTs exhibited a round microstructure with high ductility, 99.5 %.
Also, the easy sledding of their walls when attached by weak van der Waals force of coalesced MWCNTs can probably increases the relative density. The density of the sintered samples was determined using the Archimedes helium immersion method.
Microhardness and Fracture Toughness (KIC) of the Sintered M1-XTx(2≤x≤4) /1Wt% SWCNTs, (NCMC’s)
According to the above results, it can be concluded that the Vickers hardness has been improved by adding SWCNTs and enhanced with the fracture toughness value giving a better ductility for the reinforced SWCNTs samples.
(Figure 6) shows the hardness as a function of the applied indentation load for the same sample. At lower loads, the microhardness reaches a low hardness a constant value of 33.6, 14.8 and 20.6 GPa for reinforced M0.8T0.2/1Wt% SWCNTs, unreinforced TiC, and M0.6T0.4, (NCMC’s) respectively
Figure 6.Representation the variation of Vickers microhardness function of the indentation lead of MTC polished and etched surface for the sintered samples using a 20 mm diameter die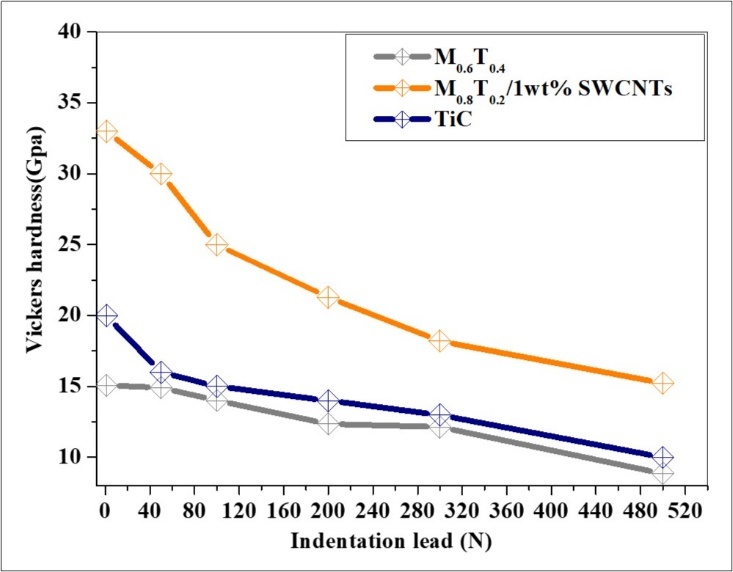
In the present study, the high hardness of the SPS synthesized sample containing (NCMC’s), M0.8T0.2/1Wt% SWCNTs at T= 1700 °C may be attributed to its high density (99.5% from theoretical).
(Figure 6) presents the variation of Vickers microhardness of M0.8T0.2/1Wt% SWCNTs, (NCMC’s) with SWCNTs reinforcement content at T= 1700 °C with the indentation lead. The microhardness of the (NCMC’s) increased almost linearly with SWCNTs reinforcement and with addition TiC (20 to 40 vol. %) content in Mo2C hard carbide.
The hardness of SWCNTs (28–30 GPa) is nearly 2 times the previously reported values of hardness of TiC (15.8GPa). For the nearly single phase Mo2C (SPS) sintered in this investigation, the microhardness was found to be 5.94 GPa (measured with indentation load of 10 N), which is higher than the previously reported hardness values for monolithic in the literature. While the higher hardness of the M0.8T0.2/1Wt% SWCNTs sample could be due to a minor amount of SWCNTs intragranular reinforced TiC grain phase in the composite Mo2C-TiC.
The microhardness in the range of about 2.5–3.5 GPa was found for lower loads (10 N). A slight increase in average hardness has been obtained from (NCMC’s) prepared by sintering M0.8T0.2/1Wt% SWCNTs at T=1700°C exhibited highest hardness of about 33.6 GPa (Figure 6). It is considered that, 40 vol% TiC and the remaining SWCNTs act as reinforcements and plays the major role in the consolidation of the products.
The best product contained M0.8T0.2/1Wt% SWCNTs which was sintered at 1700 °C, 70 MPa for 10 min. The hardness of the M0.8T0.2/1Wt% SWCNTs increases with increasing of TiC and SWCNTs content (Figure 6).
With this, the electro discharge among powders may lead to self-heating and purification of the particle surface, resulting in activation of the formation of the (NCMC’s).
The corresponding SEM micrographs around the indentation marks at the top surfaces show the lateral cracks extension from the indentation mark like ballistic impact (Figure 7).
Figure 7.SEM, BSE micrograph of cracks at the corners of Vickers indents: of etched MTC showing a purely transgranular crack growth; and revealing an intergranular crack with deflection and crack bridging: (a)-Transgranular crack, (b)- Intergranular crack, (c)- Crack deflection, d- Crack bridging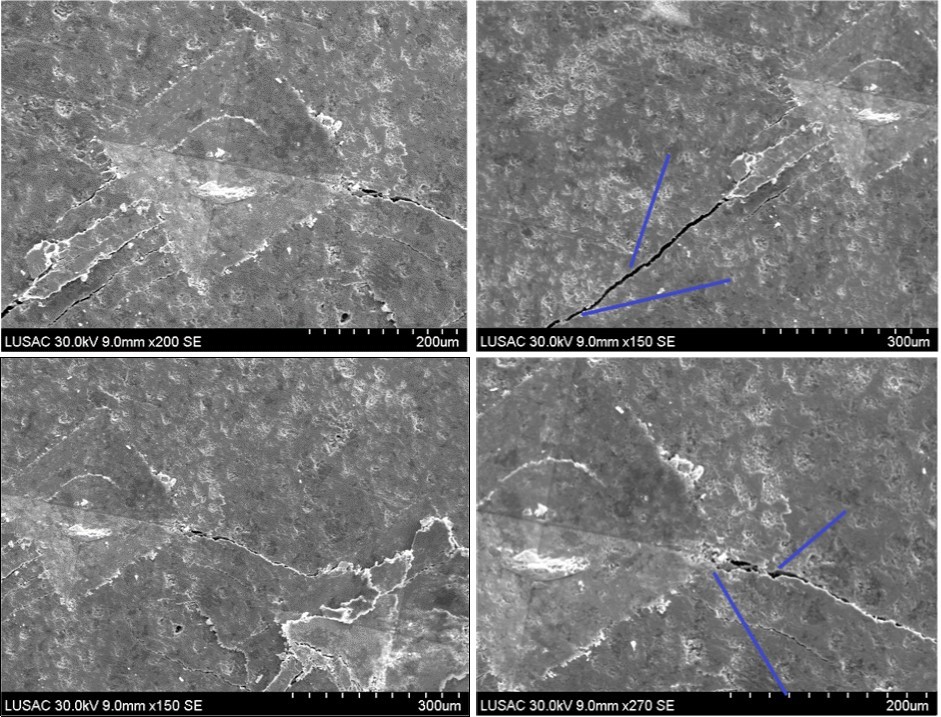
The typical micrographs of the indentations were shown in the Figure 8. For each indentation load, at least 06 tests were carried to achieve the average indentation parameter a and c.
Figure 8.Optical micrograph of crack patterns used for IFT calculations of (a, b)-MTC tested at 300 N, (c)-MTC tested at 500 N. Micrographs of cracks at the corners of Vickers indentation: (d)-Etched MTC showing a purely transgranular crack growth and (e, f)-High magnification of indentation label.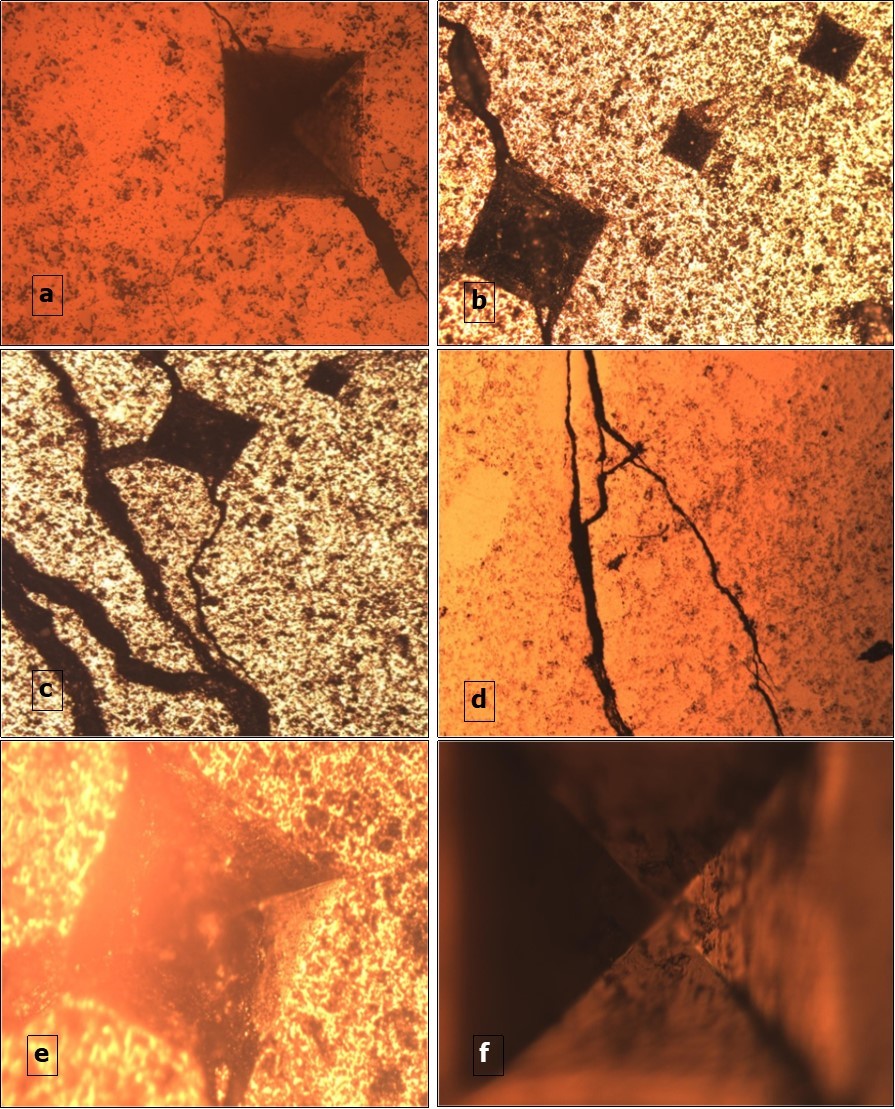
The relevant data were listed in Table 4. In Figure 9, a linear regression analysis was applied to the relations of P and c3/2 by the least square method.
Table 4. Data of Vickers indentation cracks and fracture toughness (KIC)
Figure 9.Correlation in between the applied load P, and half-length of median crack c3/2 of MTC polished and etched surface for the sintered samples using a 20 mm diameter die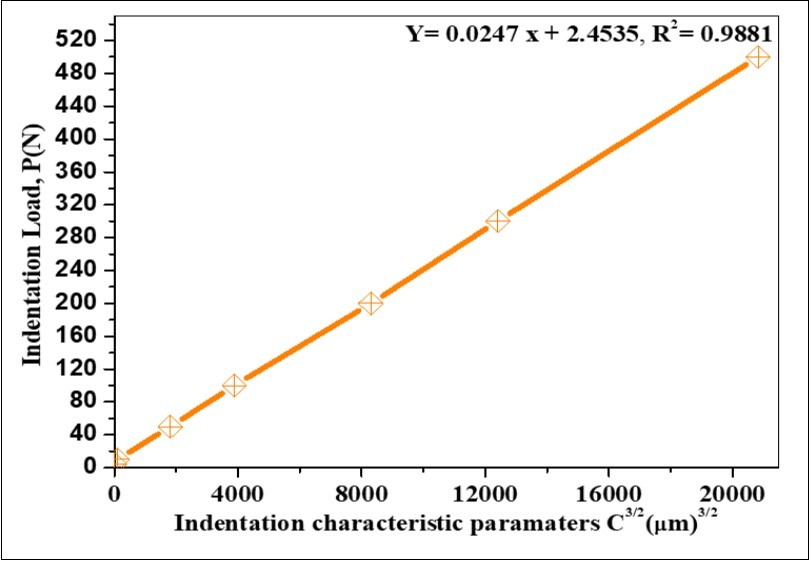
As a result, the calculated slope A and intercept B were 0.0247 and 2.4535, respectively. The indentation fracture toughness was calculated to be 5.37 MPa m1/2 for M0.8T0.2/1Wt% SWCNTs
The addition of SWCNTs play a important binderless role (the ductility) in the propagation of failler in this (NCMC’s) and thus enhance the fracture toughness in comparison with his higher hardness In addition, a high determination coefficient (R2) of 0.9881 was obtained through the linear regression model 54.
IF (indentation fracture) was shown to be an effective method in the evaluation of fracture toughness for its convenience and materials saving.
Raman Spectroscopy of M1-XTx(2≤x≤4) /1Wt% SWCNTs, (NCMC’s)
In the Figure 10 and Figure 11 is presented the Ramanresponse of the (NCMC’s), M0.8T0.2/1Wt% SWCNTs, TiC and M0.6T0.4. The TiC and Mo2C vibration response are detected around the 1256 and 1144 cm-1respectively.The reinforced phase of the binderless SWCNTs is localized in the typical frequency of G mode, D mode and Hg (7) at (1828, 1597), (1338, 1367) and 1451cm-1, respectively. The pics of the Raman spectra have confirm the XRD investigations.
Figure 10.Raman spectra of the synthetized samples using a 20 mm diameter die.
Figure 11.The explored nanocomposites regions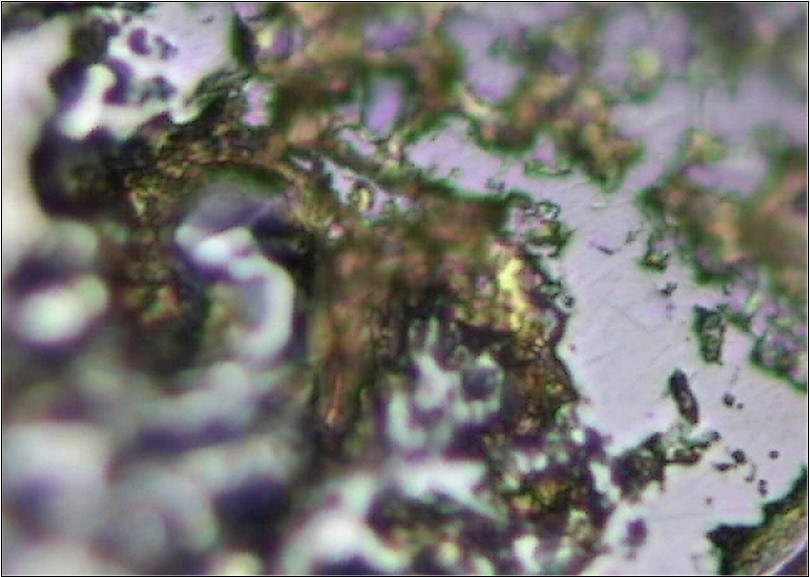
Conclusions
Several quantities of TiC ultrafine powder were added to the SPS sintered dense M1-xTx(2≤x≤4)/1Wt% SWCNTs (MTC), (NCMC’s) at 1700°C under a pressure of 70 MPa for 10 min in pure Ar atmosphere protection. Phase analysis using XRD and EDX indicated that binderless fines powders Mo2C, TiC and un-reacted binder phase SWCNTs were the main products. microstructural observations by SEM showed that the effect of SWCNTs as binder phase make interface into TiC grains and good physical (relative density) and mechanical properties (Vickers hardness, young’s modulus and fracture toughness) of (NCMC’s) are obtain for x=0.2, M0.8T0.2/1Wt% SWCNTs, SPS produced samples.The loss of SWCNTs during or conversion of SWCNTs to DWCNTs or MWCNTs the sintering processes are marqued by the holes like structure in the SEM pictures.
The challenge is to find efficiency methods for mixing of SWCNTs with the matrix composite. I suggest that SWCNTs will be metalized before mixing and sintering for minimizing their loss at high temperature.
The best density 99.5 % and ductility of the nanocomposites M0.8T0.2/1Wt% SWCNTs are obtained with the addition of the binderless reinforts phases of SWCNTs and TiC.
The fracture toughness are enhanced (ductile (NCMC’s) KIC=5.6 Mpa m1/2in comparison with his highest Vickers hardness. The Raman responses confirm the XRD investigations of the sintered samples.
Furthers measurements will be carried out with the nanoindentation technics, friction coefficient and wear resistance. Also furthers studies also will be performed with variation of the graphite die diameter, to control the SWCNTs content in the (NCMC’s), MTC.
By Field Activated Sintering Technique (SPS), the extensive volume expansion as a function of the pressure will occur.
Acknowledgements
This project is funded by the Algerian ministerium of scientifique research Alger. We are grateful to Aurélien Lepeutrec and Ibrahim Itaalit (LUSAC, EA 4253, Université de Caen Basse-Normandie (UCBN), (Cherbourg-Octeville, France) for the helps in the FESEM. Many thanks go to Pr. Dominique Vrel from LIMHP, Paris, France and Pr. Kamel Loucif from the University of Setif, Algeria for the XRD investigations.
Without forgetting Yannick for the accuracy measurements in Resonant Raman Scattering Spectroscopy.
References
- 1.K Sangeetha, Meena K S, PMagesan.A Manikandan. K Jayamoorth.(2019).Photodynamic activity and DNA binding studies of Pd@ SiO2 core-shell nanoparticles in vitro,Photodiagnosisand photodynamic therapy 26, 79-84.
- 2.Dhanalekshmi K I, Magesan P, Sangeetha K, Zhang X, Jayamoorthy K et al. (2019) Preparation and characterization of core-shell type Ag@SiO2 nanoparticles for photodynamic cancer therapy, Photodiagnosis and photodynamic therapy 28. 324-329.
- 3.Suresh S, Nisha P, Saravanan P, Jayamoorthy K, Karthikeyan S. (2018) Investigation of the Thermal and Dielectric Behavior of Epoxy Nano-Hybrids by using Silane Modified Nano-ZnO. , Silicon 10(4), 1291-1303.
- 4.Suresh S, Jayamoorthy K, Karthikeyan S. (2018) Switch-on fluorescence of 5-amino-2-mercapto benzimidazole by Mn3O4nanoparticles: Experimental and theoretical approach. , Journal of Luminescence 198, 28-33.
- 5.Suresh S, Karthikeyan S, Jayamoorthy K, Saravanan P. (2016) Comparison of antibacterial and antifungal activities of 5-amino-2-mercaptobenzimidazole and functionalized NiO nanoparticles. , Karbala International Journal of Modern Science 2(3), 188-195.
- 6.Suresh S, Karthikeyan S, Jayamoorthy K. (2016) FTIR and multivariate analysis to study the effect of bulk and nano copper oxide on peanut plant leaves. , Journal of Science: Advanced Materials and Devices 1(3), 343-350.
- 7.Suresh S, Karthikeyan S, Jayamoorthy K. (2016) Fluorescence sensing of potential NLO material by bunsenite NiO nanoflakes: Room temperature magnetic studies, Sensors and Actuators B: Chemical 232. 269-275.
- 8.Saravanan P, Jayamoorthy K, S A Kumar. (2016) Fluorescence quenching of APTES by Fe2O3nanoparticles–Sensor and antibacterial applications. , Journal of Luminescence 178, 241-248.
- 9.K S Meena, K I Dhanalekshmi, Jayamoorthy K. (2016) Study of photodynamic activity of. Au@SiO2 core-shell nanoparticles in vitro, Materials Science and Engineering: C 63 317-322.
- 10.Suresh S, Karthikeyan S, Saravanan P, Jayamoorthy K, Dhanalekshmi K I. (2016) Comparison of antibacterial and antifungal activity of 5-amino-2-mercapto benzimidazole and functionalized Ag3O4nanoparticles. , Karbala International Journal of Modern Science 2(2), 129-137.
- 11.Suresh S, Karthikeyan S, Jayamoorthy K. (2016) Spectral investigations to the effect of bulk and nano ZnO on peanut plant leaves. , Karbala International Journal of Modern Science 2(2), 69-77.
- 12.Suresh S, Saravanan P, Jayamoorthy K, S A Kumar, Karthikeyan S. (2016) Development of silane grafted ZnO core shell nanoparticles loaded diglycidyl epoxy nanocomposites film for antimicrobial applications. , Materials Science and Engineering: C 64, 286-292.
- 13.Suresh S Karthikeyan S, Jayamoorthy K. (2016) Effect of bulk and nano-Fe2O3particles on peanut plant leaves studied by Fourier transform infrared spectral studies. , Journal of Advanced Research 7(5), 739-747.
- 14.Suresh S, Jayamoorthy K, Saravanan P, Karthikeyan S. (2016) Switch-Off fluorescence of 5-amino-2-mercapto benzimidazole with Ag3O4nanoparticles: Experimental and theoretical investigations, Sensors and Actuators B: Chemical 225. 463-468.
- 53.Rocha-Rangel E. (2011) Fracture toughness determinations by means of indentation fracture, in:. D.J. Cuppoletti (Ed.), Nanocomposits with Unique Properties and Applications in Medicine and Industry.21 .